Tag: SVM

  • ML0088 SVM Scaling

    Why do SVMs scale poorly to very large datasets, and what can you do about it when you need to classify millions of samples?

    Answer

    The bottleneck is the kernel matrix. A kernel SVM solves a quadratic program whose dual involves an n \times n Gram matrix of pairwise kernel evaluations, which costs O(n^2) storage and between O(n^2) and O(n^3) time depending on the solver and regularization. Beyond tens of thousands of samples the full matrix no longer fits in memory, and the QP solver’s iteration count grows with the number of support vectors, which itself scales roughly linearly with n. Scikit-learn’s documentation states this explicitly: SVC “scales at least quadratically with the number of samples and may be impractical beyond tens of thousands of samples,” and recommends LinearSVC or SGDClassifier for large datasets. The production answer is to either drop the kernel (linear SVM), approximate it (Nyström, Random Fourier Features), or accelerate the computation on GPU (NVIDIA RAPIDS cuML).

    (1) Kernel Matrix Bottleneck: the dual QP requires the full n \times n kernel matrix in memory; at 1 million samples this is 8 TB in float64, and the solver time is superlinear in n.
    (2) Support Vector Growth: the number of support vectors grows roughly linearly with training size, so inference cost also grows with n, unlike a fixed-size linear model.
    (3) Production Solutions: scikit-learn recommends LinearSVC (liblinear, scales to millions) or kernel approximation via Nystroem transformer; RAPIDS cuML provides GPU acceleration for SVC and SVR; EigenPro 3.0 (ICML 2023) decoupled model size from data size, training on 5 million samples with 1 million centers.

    Line chart of relative training time versus training samples from 1K to 100K: kernel SVC curves upward quadratically, LinearSVC and Nystrom plus linear solver both rise linearly, with an annotation that kernel SVM becomes impractical beyond about 50K samples

    Figure 1: Training time versus dataset size: kernel SVM grows as O(n^2) to O(n^3) because of the full Gram matrix and QP solver, while linear SVM (LinearSVC) and Nyström-approximated kernel SVM both scale near-linearly with a larger constant for the approximation.

    The practical toolkit has four tiers. First, if a linear boundary is acceptable, use LinearSVC (liblinear) or SGDClassifier with hinge loss, both of which scale to millions of samples and features because they never form a kernel matrix. Second, if you need nonlinearity, approximate the kernel map: Nyström approximation samples m landmark points (m much less than n) and replaces the n-by-n matrix with a rank-m factorization, and Random Fourier Features (RFF) map data into an explicit finite-dimensional space where a linear solver applies; ICML 2024 showed Quasi-Monte Carlo features improve RFF’s error from O(1/sqrt(M)) to O(1/M). Third, GPU-accelerate: RAPIDS cuML provides zero-code-change GPU dispatch for SVC and SVR. Fourth, for true kernel-method scale, EigenPro 3.0 (ICML 2023) uses preconditioned SGD to train kernel models with 1 million centers on 5 million samples, decoupling model size from data size for the first time.

    Decision tree starting from a large dataset above 100K samples: if linearly separable use LinearSVC or SGDClassifier; if not, ask whether a GPU is available, where no leads to Nystrom or Random Fourier Features with a linear solver and yes leads to RAPIDS cuML or EigenPro 3.0

    Figure 2: A practical decision flow: linearly separable data uses LinearSVC or SGDClassifier; if the boundary must be nonlinear, CPU-only setups use Nyström or Random Fourier Features with a linear solver, while GPU hardware unlocks RAPIDS cuML or EigenPro 3.0’s preconditioned SGD.

    Mathematical Formulation:
    \min_{\alpha} \;\frac{1}{2}\alpha^\top Q\,\alpha - \mathbf{1}^\top \alpha
    \text{s.t.}\quad y^\top \alpha = 0,\quad 0 \leq \alpha_i \leq C
    Q_{ij} = y_i y_j\, K(x_i, x_j)

    Where:

    • \alpha is the dual variable vector; nonzero entries identify support vectors, and the solution is sparse but the number of support vectors grows with n.
    • Q is the n \times n kernel (Gram) matrix with entries Q_{ij} = y_i y_j K(x_i, x_j); storing it costs O(n^2) and solving the QP costs O(n^2) to O(n^3) depending on cache efficiency and C.
    • K is the kernel function (RBF, polynomial, etc.); C is the regularization parameter. Larger C means fewer support vectors but longer solver convergence, pushing toward the O(n^3) end.
    ApproachTraining CostPractical Limit
    Kernel SVC (libsvm)O(n^2) to O(n^3)Tens of thousands of samples
    LinearSVC (liblinear)O(n) per iterationMillions of samples and features
    Nyström + LinearSVCO(nm) for approximationHundreds of thousands with nonlinearity
    RAPIDS cuML (GPU)Parallelized QP on GPUZero-code-change from sklearn, GPU memory bound
    EigenPro 3.0O(np + p^2) per epoch5 million samples, 1 million centers (ICML 2023)

    Login to view more content
  • ML0053 Hinge Loss for SVM

    Explain the Hinge Loss function used in SVM.

    Answer

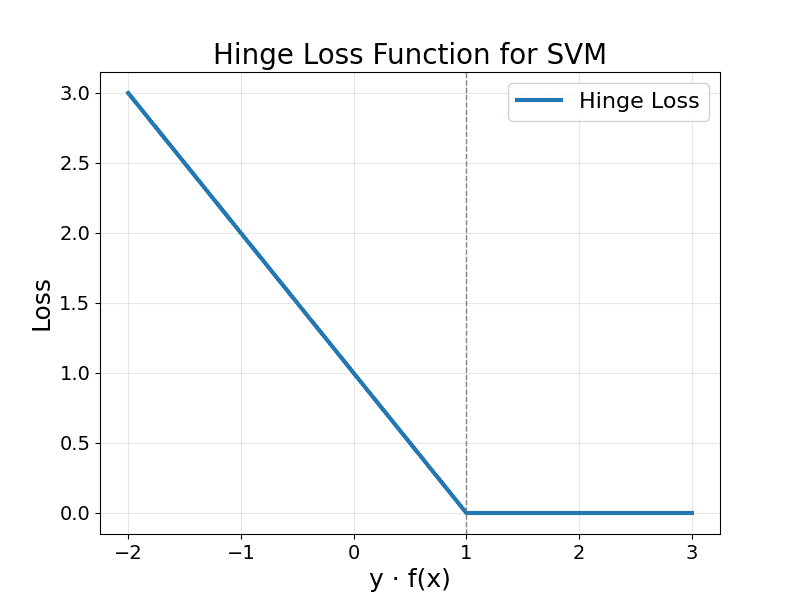
    The hinge loss is the key element of Support Vector Machines: it penalizes both misclassified points and correctly classified points that lie inside the margin. Points classified correctly with margin to spare get zero loss; the loss grows linearly as a point moves toward or across the decision boundary. This structure is exactly what pushes the SVM to maximize the margin, promoting robust, generalizable boundaries.

    (1) Zero Loss Zone: When y \cdot f(\mathbf{x}) \geq 1, the point is correctly classified and outside (or exactly on) the margin, the loss is 0.
    (2) Linear Penalty Zone: When y \cdot f(\mathbf{x}) falls below 1, i.e., inside the margin or misclassified, the loss grows linearly with the violation.
    (3) Convex But Not Smooth: The kink at y \cdot f(\mathbf{x}) = 1 makes the function non-differentiable there, so optimization uses subgradients instead of plain gradients.

    Hinge loss curve at zero beyond margin one and increasing linearly for smaller or negative margins with a kink at one

    Figure 1: Hinge loss vs the margin y \cdot f(\mathbf{x}): flat at zero once the point is beyond the margin (right of the dashed line at 1), ramping up linearly inside the margin and for misclassified points (left of it). The kink at 1 is where subgradients take over.

    Mathematical Formulation:
    \text{Hinge Loss} = \max\big(0,\; 1 - y \cdot f(\mathbf{x})\big)

    Where:

    • y \in \{-1, +1\} is the true label.
    • f(\mathbf{x}) is the raw model output (the signed score, before any threshold).
    • The product y \cdot f(\mathbf{x}) is the (functional) margin: positive means correctly classified, ≥ 1 means correct with margin.

    Login to view more content
  • ML0052 Non-Linear SVM

    Can you explain the concept of a non-linear Support Vector Machine (SVM)?

    Answer

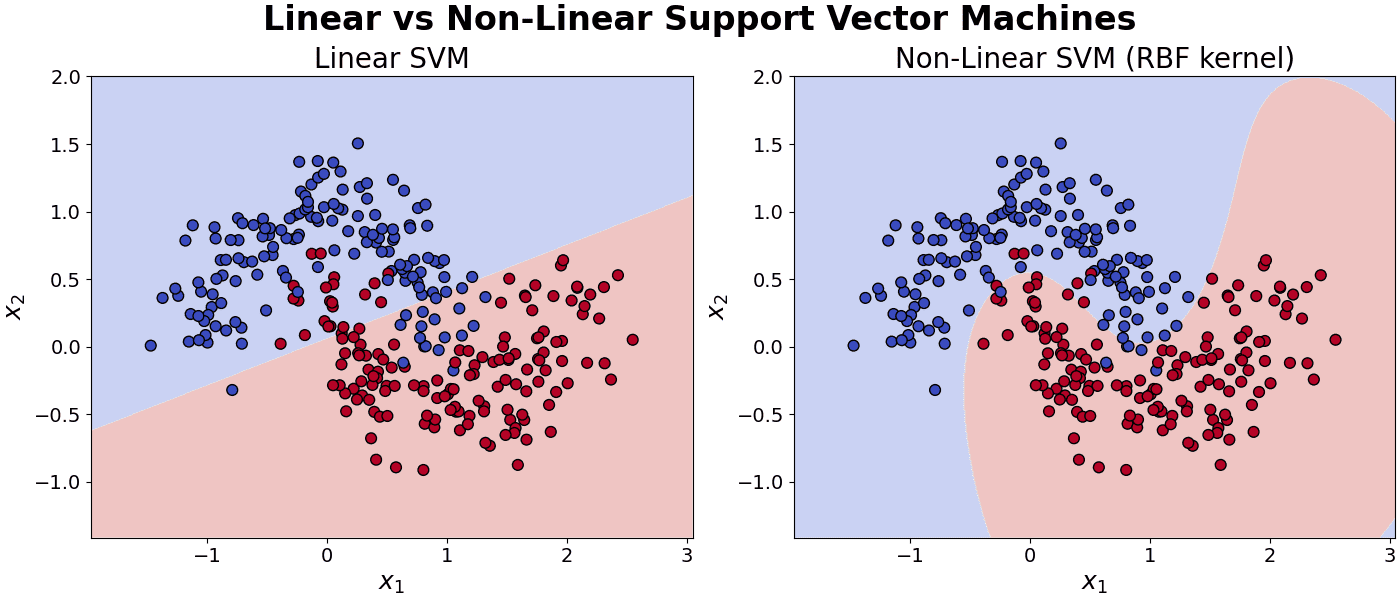
    A non-linear SVM classifies data that is not linearly separable by using a kernel function to implicitly project the data into a higher-dimensional space where a linear separator exists. This kernel trick provides flexibility for complex datasets while staying computationally efficient: the algorithm never computes the high-dimensional coordinates, only inner products through the kernel. The kernel choice (RBF, polynomial, sigmoid) strongly influences performance and adaptability.

    (1) Kernel Trick: Replace inner products with a kernel K(\mathbf{x}_i, \mathbf{x}_j), which measures similarity as if the data were mapped to a higher-dimensional space, where a linear separation becomes possible.
    (2) Common Kernels: Polynomial (captures feature interactions of degree d), RBF/Gaussian (local similarity decaying with distance), sigmoid (imitates a neural activation).
    (3) Objective: Find the margin-maximizing hyperplane in the transformed space; in the original space its image is a curved decision boundary.

    Two panels on interleaving moons data showing the linear SVM's straight boundary cutting through a class and the RBF SVM's curved boundary separating them cleanly

    Figure 1: Same data, two SVMs: the linear kernel can only slice the moons with a straight line (left), while the RBF kernel’s implicit high-dimensional map lets the boundary bend around both crescents (right).

    Mathematical Formulation:
    K(\mathbf{x}_i, \mathbf{x}_j) = (\gamma\, \mathbf{x}_i^\top \mathbf{x}_j + c)^d
    K(\mathbf{x}_i, \mathbf{x}_j) = \exp\big(-\gamma \|\mathbf{x}_i - \mathbf{x}_j\|^2\big)
    K(\mathbf{x}_i, \mathbf{x}_j) = \tanh(\gamma\, \mathbf{x}_i^\top \mathbf{x}_j + c)

    Where (polynomial, RBF, sigmoid kernels in order):

    • \mathbf{x}_i, \mathbf{x}_j are input vectors; \gamma scales the inner product or controls the RBF width (\gamma = 1/(2\sigma^2), with \sigma the Gaussian spread).
    • c is a constant (bias) term and d the polynomial degree.
    • \|\mathbf{x}_i - \mathbf{x}_j\|^2 is the squared Euclidean distance: nearby points get RBF similarity near 1, distant points near 0.
    Left panel one dimensional class data not separable by a point, right panel the same data lifted to two dimensions by x squared mapping and separated by a straight line

    Figure 2: The kernel idea made concrete: in 1-D the blue class sits between the oranges and no single threshold separates them; after the explicit lift x \mapsto (x, x^2) the classes part vertically and one straight line suffices. Kernels compute as if this lift happened, without ever forming the new coordinates.


    Login to view more content
  • ML0051 Linear SVM

    Can you explain the key concepts behind a Linear Support Vector Machine?

    Answer

    A Linear Support Vector Machine (Linear SVM) is a classifier that finds the optimal straight line (hyperplane) separating two classes by maximizing the margin between them. It relies on a few critical points (the support vectors) and offers strong generalization, especially on linearly separable data.

    (1) Hyperplane: The decision boundary that separates data points of different classes.
    (2) Margin: The distance between the hyperplane and the nearest data point of each class; the SVM maximizes it.
    (3) Support Vectors: The points lying closest to the hyperplane; they alone define it: moving any other point changes nothing.
    (4) Objective: Maximize the margin while minimizing classification error (hard margin forbids error; soft margin prices it in).

    Hard margin SVM with two separable point clouds, solid decision boundary, two dashed margin lines, and circled support vectors

    Figure 1: Hard-margin SVM: the solid hyperplane w^T x + b = 0 sits midway between the dashed margins w^T x + b = \pm 1, and only the circled support vectors touch the margin: they alone determine the boundary.

    Mathematical Formulation:
    f(\mathbf{x}) = \mathbf{w}^\top \mathbf{x} + b
    \hat{y} = \mathrm{sign}(\mathbf{w}^\top \mathbf{x} + b) = \mathrm{sign}(f(\mathbf{x}))
    \min_{\mathbf{w}, b} \; \frac{1}{2} \|\mathbf{w}\|^2
    \text{subject to } y_i(\mathbf{w}^\top \mathbf{x}_i + b) \geq 1 \quad \text{for all } i

    Where:

    • \mathbf{x} is the input feature vector, \mathbf{w} the weight vector, b the bias; \hat{y} is the predicted label.
    • \mathrm{sign}(\cdot) returns +1 if its argument is ≥ 0 and −1 otherwise; y_i \in \{-1, +1\} is the true label of point \mathbf{x}_i.
    • Minimizing \frac{1}{2}\|\mathbf{w}\|^2 under those constraints is the hard-margin objective: since the margin width is 2 / \|\mathbf{w}\|, small \|\mathbf{w}\| means a wide margin.

    Login to view more content