Tag: Transformer

  • DL0112 VLM Visual Grounding

    How do VLMs perform Visual Grounding (predicting 2D/3D bounding boxes)?

    Answer

    Visual grounding asks the model to return the image region a phrase refers to, and current VLMs differ mainly in where the coordinates are physically produced. The dominant generalist recipe treats a box as text: coordinates are normalized and quantized onto a fixed grid (Kosmos-2 adds 1024 dedicated location tokens, Qwen-VL emits integers from 0 to 999 inside <box> markers, Qwen2.5-VL moved to absolute pixel values inside JSON) and the language model decodes them autoregressively under ordinary cross-entropy, so detection, referring expression comprehension, and grounded captioning all become one sequence task. The specialist recipe keeps a DETR-style decoder with learnable queries, a box regression head, and L1 plus GIoU losses, fusing text into the visual features and aligning region embeddings to word embeddings contrastively (MDETR, GLIP, Grounding DINO, Florence-2). A third, hybrid recipe uses an LLM hidden state as a prompt for an external mask or box decoder, as LISA does by feeding a <SEG> embedding to SAM. Whichever decoder is used, localization quality is mostly decided upstream: the connector has to hand the LLM patch tokens with their 2D layout and position information intact, at a resolution where the target object still covers several patches. 3D grounding extends the output to a 7 to 9 DoF box and introduces the real difficulty, depth and scale ambiguity, resolved either from point clouds (ScanRefer-style proposal-and-match pipelines) or monocularly with camera intrinsics, as in Cube-LLM.

    (1) Coordinates As Text: a box becomes four discrete symbols on a normalized grid, so the only training signal is token cross-entropy, with no IoU-aware term and no set matching.
    (2) The Connector Decides Localization: raster-ordered ViT patch tokens through an MLP projector preserve geometry, while abstractors that pool everything into a few dozen learned queries discard the spatial layout a box depends on.
    (3) Resolution Beats Bin Count: quantization error at 1000 bins is sub-pixel, but a small object that occupies one patch cannot be localized tightly at any bin resolution, which is why dynamic resolution and tiling (AnyRes, Qwen2-VL M-RoPE) matter more than the tokenizer.
    (4) Detection-Head Decoding: query-based decoders with region-word contrastive alignment still lead on tight-IoU metrics and emit hundreds of boxes in a single forward pass.
    (5) Hidden State As Prompt: a referent or <SEG> token embedding can drive SAM or a 3D mask decoder, decoupling language reasoning from pixel-level decoding.
    (6) 3D Adds Scale, Not Just Dimensions: monocular predictions are only consistent if camera intrinsics enter the model or the normalization, otherwise depth estimates do not transfer across datasets.
    (7) Metrics And Supervision: RefCOCO family Acc@0.5 for 2D, [email protected] on ScanRefer for 3D, and every box target must be expressed in the same resized or tiled frame the encoder sees.

    Diagram of a vision language model grounding pipeline: image, ViT encoder, MLP projector, LLM decoder, and three output paths producing location tokens, a referent hidden state for SAM or a DETR box head, and a 3D head using camera intrinsics

    Figure 1: One shared perception stack, three places to produce coordinates. The path image → ViT patches → projector → LLM is identical; only the last stage differs, and the projector is where grounding is usually won or lost.

    It is worth doing the arithmetic on the tokenizer, because interviewers often assume quantization is the limiting factor. With a 1000-bin normalized grid on a 1344 px side, the worst-case error per edge is about 0.67 px, far below what Acc@0.5 can detect. The real sensitivity is object size: a square object of side s whose four edges each shift by d has \mathrm{IoU} = (s-d)^2 / (2s^2 - (s-d)^2), so a 16 px object falls below 0.5 IoU once edges move about 3 px, while a 128 px object tolerates roughly 24 px. That is why generalist grounding scores jumped with higher effective input resolution rather than with finer coordinate grids: the earliest text-token generalists sat near 52 Acc@0.5 on RefCOCO val, Qwen-VL reached roughly 89, and Florence-2-L about 93, close to dedicated grounding detectors.

    Mathematical Formulation:
    t_k = \mathrm{round}\left(\frac{c_k}{S}(n-1)\right)
    p(b \mid I, q) = \prod_{k=1}^{4} p(t_k \mid I, q, t_{1:k-1})
    \epsilon_{\max} = \frac{S}{2(n-1)}
    \epsilon_{\max} = \frac{1344}{2 \cdot 999} \approx 0.67
    \mathcal{L}_{\mathrm{box}} = \lambda_1 \lVert b - \hat{b} \rVert_1 + \lambda_2 (1 - \mathrm{GIoU})
    B_{3D} = (x, y, z, w, h, l, \theta)
    (u, v, 1)^{\top} = \frac{1}{z} K (x, y, z)^{\top}

    Where:

    • b = (c_1, c_2, c_3, c_4) is the target box in the encoder’s resized pixel frame of side S, and \hat{b} is the prediction.
    • t_k is the k-th coordinate token and n the number of bins (1024 for Kosmos-2 location tokens, 1000 for Qwen-VL integers).
    • I is the image, q the referring expression, and t_{1:k-1} the previously emitted coordinate tokens, so decoding is strictly autoregressive.
    • \epsilon_{\max} is the worst-case quantization error per edge in pixels, which scales linearly with input side and inversely with bin count.
    • \lambda_1, \lambda_2 weight the L1 and GIoU terms used by regression-head decoders; text-token models have no analogue of either.
    • B_{3D} is a 3D box with center (x, y, z), extents (w, h, l), and yaw \theta; full 9 DoF variants add pitch and roll.
    • K is the camera intrinsic matrix and (u, v) the projected image point; this constraint is the required initial condition for monocular 3D grounding, since without K the depth z and the extents trade off freely.
    Two panel chart: left panel shows worst-case per-edge quantization error in pixels versus number of coordinate bins for 448, 1344 and 3840 pixel inputs on log axes; right panel shows IoU versus per-edge shift in pixels for 16, 32 and 128 pixel objects with an IoU equals 0.5 threshold line

    Figure 2: Left: a 1000-bin grid costs well under one pixel per edge even at high resolution, so coordinate tokenization is rarely the bottleneck. Right: the Acc@0.5 budget is roughly 3 px of edge error for a 16 px object, 6 px for 32 px, and 24 px for 128 px, which is why small-object grounding is an effective-resolution problem.

    PropertyCoordinates as text tokens (Kosmos-2, Qwen-VL)Detection-head decoding (MDETR, Grounding DINO, Florence-2)Hidden state as decoder prompt (LISA, Grounded 3D-LLM)
    Where coordinates appearIn the text stream, as quantized or absolute numbers inside markers or JSONFrom query embeddings in a cross-modal decoder with an explicit box headImplicitly: a referent token embedding conditions an external mask or box decoder
    Training signalToken cross-entropy only, no IoU termL1 plus GIoU with Hungarian matching, plus region-word contrastive alignmentMask or box loss backpropagated into the LLM through the prompt embedding
    Multi-instance outputCosts about 4 to 8 decoded tokens per box, so dense scenes are slowHundreds of boxes in one parallel forward passOne region per referent token; needs several tokens for several targets
    StrengthUnifies grounding with dialogue, counting, OCR, and grounded captioning in one headBest tight-IoU accuracy and recall under a fixed latency budgetPixel-accurate masks and 3D shapes without teaching the LLM geometry
    Typical failureHallucinated coordinates for absent objects, plus parse failures and no calibrated confidenceWeak compositional or relational language, since reasoning capacity is limitedTwo-stage error coupling; the frozen decoder caps achievable boundary quality

    Login to view more content
  • DL0111 SigLIP vs CLIP

    What are the differences between SigLIP and CLIP?

    Answer

    CLIP and SigLIP share the same dual-encoder architecture, the same cosine-similarity scoring, and the same zero-shot classification recipe; the substantive difference is the training objective. CLIP optimizes a softmax InfoNCE loss in which each image’s logit row is normalized over every text in the batch and each text’s column over every image, so the loss contribution of a single pair depends on the entire batch, and the distributed implementation needs an all-gather plus a global normalization pass. SigLIP replaces this with a pairwise sigmoid loss that treats each of the N^2 cells of the similarity matrix as an independent binary decision (“is this a real pair?”), using a shared learnable temperature plus a learnable bias b initialized to -10 to absorb the fact that only N of the N^2 pairs are positive. Because nothing is normalized across the batch, the loss decomposes into b \times b blocks, which lets SigLIP be implemented as a memory-efficient ring over devices and trained at batch sizes a softmax implementation cannot fit. Empirically the sigmoid loss is clearly better at small and moderate batch sizes, the two objectives converge above roughly 32k examples per step, and the million-example batch study SigLIP made possible showed that accuracy saturates long before that. That efficiency, plus the shape-optimized SoViT-400m/14 backbone released with it, is why SigLIP checkpoints became the default vision tower in many recent vision-language models such as PaliGemma.

    (1) Loss Form: CLIP uses two symmetric softmax cross-entropies over the batch; SigLIP uses one binary logistic loss per pair, summed over the full N \times N grid.
    (2) Batch Coupling: softmax logits are only meaningful after a global normalization, so every device must see all 2N embeddings; sigmoid logits are independent, so blocks can be scored and reduced locally.
    (3) Extra Bias Parameter: the sigmoid objective faces an extreme N^2 - N negatives against N positives imbalance, which the learnable bias fixes by starting every logit near “not a pair”.
    (4) Batch-Size Behavior: sigmoid wins at 4k to 16k, matches softmax above roughly 32k, and both saturate rather than improving toward one million.
    (5) Everything Else Is Unchanged: image tower, text tower, unit-norm embeddings, and prompt-based zero-shot evaluation are identical, so SigLIP is effectively a drop-in replacement at the loss layer.
    (6) Practical Differences In The Checkpoints: public English SigLIP models use a 32k SentencePiece vocabulary with a 64-token text context (the original paper’s initial experiments used 16, but the released checkpoints increased it to 64), shorter than CLIP’s 77-token BPE context, which matters when captions are long.

    Two 4 by 4 image-text similarity matrices. On the left, arrows show softmax normalization along every row and every column, coupling all pairs. On the right, each cell is an independent binary label scored by a sigmoid with learnable temperature and bias.

    Figure 1: Both objectives see the same similarity matrix. CLIP normalizes each row and column, so a single logit’s gradient depends on the whole batch; SigLIP scores each cell as an independent binary label with a shared temperature and bias, which removes the coupling entirely.

    Mathematical Formulation:
    s_{ij} = t\, x_i^{\top} y_j
    \mathcal{L}_{\mathrm{i2t}} = -\frac{1}{N}\sum_{i} \log \frac{e^{s_{ii}}}{\sum_{j} e^{s_{ij}}}
    \mathcal{L}_{\mathrm{t2i}} = -\frac{1}{N}\sum_{j} \log \frac{e^{s_{jj}}}{\sum_{i} e^{s_{ij}}}
    \mathcal{L}_{\mathrm{CLIP}} = \tfrac{1}{2}\left(\mathcal{L}_{\mathrm{i2t}} + \mathcal{L}_{\mathrm{t2i}}\right)
    \mathcal{L}_{\mathrm{SigLIP}} = \frac{1}{N}\sum_{i}\sum_{j}\log\left(1 + e^{-z_{ij}(s_{ij} + b)}\right)

    Where:

    • x_i and y_j are the unit-norm image and text embeddings, so x_i^{\top} y_j is a cosine similarity in [-1, 1].
    • s_{ij} is the scaled logit and t = \exp(t') is the learnable temperature, parameterized in log space in both methods.
    • i, j \in \{1, \ldots, N\} index the global batch; the diagonal i = j holds the N true pairs and the off-diagonal holds N^2 - N negatives.
    • z_{ij} = +1 for a matched pair and z_{ij} = -1 otherwise, which is the binary label the sigmoid loss regresses on.
    • b is the learnable bias unique to SigLIP, with the required initialization b = -10 and t' = \log 10; CLIP has no analogue because its softmax is shift-invariant.

    The engineering consequence is the part interviewers usually probe. In a softmax implementation the batch is a single indivisible unit: after the all-gather each of the D devices holds all 2N embeddings and materializes an N \times b logit slab, and the row and column sums must be reduced across devices before any gradient exists. SigLIP instead keeps each device’s image chunk local and passes text chunks around a ring, accumulating loss from one b \times b block at a time, so peak logit memory drops by a factor of D and no cross-device normalization is needed. This is exactly what allowed the authors to sweep batch size up to one million and demonstrate saturation, and it is also why the SigLiT variant, which locks a pretrained image tower and trains only the text side, reached 84.5% ImageNet zero-shot accuracy in two days on four TPUv4 chips. The trade-off is two extra hyperparameters to get right: a badly initialized bias makes the first thousands of steps a wasted fight against the negative-pair prior.
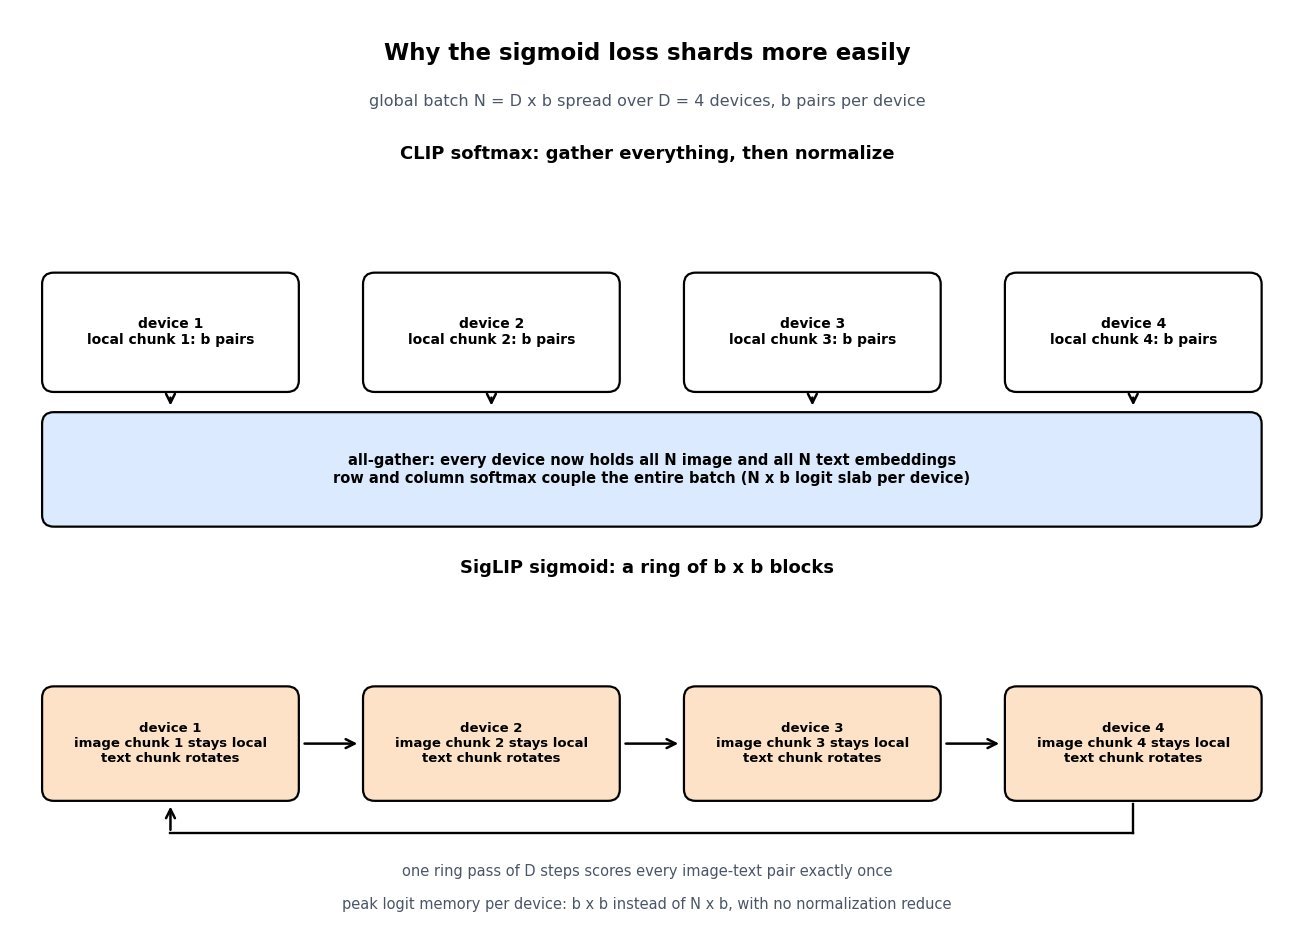
    Top panel: four devices each holding a local chunk feed into an all-gather box where every device holds all N embeddings for a global softmax. Bottom panel: four devices keep their image chunk local while text chunks rotate around a ring, scoring one b by b block per step.

    Figure 2: The softmax loss forces an all-gather and a global normalization, so each device carries an N \times b logit slab. The sigmoid loss decomposes, so a ring of D steps covers every pair while only b \times b logits exist at once.

    PropertySigLIP (sigmoid loss)CLIP (softmax InfoNCE)
    ObjectiveOne binary logistic loss per image-text pair over the full gridTwo symmetric cross-entropies over row-wise and column-wise softmax
    Batch couplingNone; the loss is a sum of independent termsGlobal; every logit is normalized against the whole batch
    Extra parametersLearnable temperature plus a learnable bias, initialized to log 10 and -10Learnable temperature only; a bias would cancel in the softmax
    Distributed costChunked ring; peak logit memory b x b per device, no normalization reduceAll-gather of all embeddings plus an N x b logit slab per device
    Small batch (4k to 16k)Clearly stronger zero-shot accuracy at equal examples seenDegrades noticeably; the normalization has few negatives to work with
    Very large batchFeasible up to one million, but accuracy saturates near 32kComparable above roughly 32k, but memory-bound before that
    Text context64 tokens (16 in the original paper), 32k SentencePiece in the English releases77 tokens, 49k byte-pair vocabulary
    Typical role todayDefault frozen vision tower for many VLMs, notably SoViT-400m/14Legacy ecosystem: diffusion text conditioning, CLIPScore, many distilled models

    Login to view more content
  • DL0110 VLM Image-Text Token Alignment

    How do you align image tokens with text tokens in a vision-language model, for example in a system like LLaVA or Qwen2-VL?

    Answer

    Alignment is not one operation but three that have to agree: a representation map, a sequence layout, and a training curriculum. The dominant recipe runs a frozen contrastive vision encoder over the image, then a small trainable connector projects every patch embedding into the LLM’s token embedding space so the image becomes a block of ordinary tokens occupying real sequence positions. A CLIP ViT-L/14 at 336 \times 336 produces 24 \times 24 = 576 patch embeddings of width 1024, and a two-layer MLP maps them to the LLM width (4096 for a 7B decoder); the tokenizer’s single image placeholder is expanded in place into those 576 vectors. From that point alignment is learned by plain next-token prediction: text tokens read image positions through the same causal self-attention, and the gradient of the caption loss is what teaches the connector which visual direction means “a red bus”. The competing topology keeps images out of the sequence entirely and injects them through gated cross-attention layers inserted into a frozen LLM, as in Flamingo and Llama 3.2 Vision, trading sequence length for extra parameters.

    (1) Shared Embedding Space: the connector’s only job is to land visual features in the same d_{\text{model}}-dimensional space the token embedding table lives in, which is why an MLP with roughly 20M parameters is enough.
    (2) Placeholder Expansion: the prompt carries one image placeholder id, and at embedding time that row is replaced by the N projected vectors, so nothing downstream of the embedding layer knows the difference.
    (3) Positional Alignment: patches are flattened row-major, so a purely 1D RoPE makes a vertical neighbor 24 positions away; 2D or multimodal RoPE restores height and width structure explicitly.
    (4) Two Injection Topologies: prefix tokens with full self-attention are simple and preserve fine detail; gated cross-attention keeps the text stream’s length untouched and protects text-only ability.
    (5) Staged Curriculum: stage 1 tunes only the connector on image-caption pairs with a frozen encoder and LLM, then stage 2 unfreezes the LLM on instruction data.
    (6) Token Budget Is The Real Constraint: prefill attention is O(L^2) in total sequence length, so pixel unshuffle, learned query resamplers, and tiling policies exist purely to control N.

    Pipeline diagram: a 336 by 336 image is encoded by a frozen ViT-L/14 into 576 patch features of width 1024, an MLP connector projects them to 4096 dimensions, and the resulting image tokens are spliced into the LLM token sequence between text embeddings before a causal decoder stack

    Figure 1: The connector is the only trainable component in stage 1; after projection the 576 image tokens are indistinguishable from text embeddings to the decoder, which fuses both streams in a single causal self-attention stack.

    Two details decide whether the alignment survives at scale. The first is resolution: a fixed 336 \times 336 view destroys the small text and thin structures that document and chart questions depend on, so production models either tile the image into crops plus a downscaled thumbnail (AnyRes) or feed native resolution with a variable token count. The second is cost: because prefill attention grows quadratically, an AnyRes scheme with four crops plus a thumbnail spends 2,880 image tokens and roughly 25x the attention work of one 576-token view, before a single text token is generated. Compression is the usual answer, either a 2 \times 2 pixel unshuffle that folds four patches into one channel-concatenated token or a query-based resampler that squeezes any number of patches into 32 or 64 learned slots. Both save compute by throwing away exactly the spatial precision that grounding and OCR need, which is why token budget, not connector architecture, is where most VLM design arguments actually land.

    Mathematical Formulation:
    Z_v = g_{\phi}(x_{\text{img}})
    H_v = W_2\,\sigma(W_1 Z_v)
    N = \frac{H W}{P^2 r^2}
    N = \frac{336 \cdot 336}{14^2 \cdot 1} = 576
    E = [\, e(t_{1:k}),\; H_v,\; e(t_{k+1:m}) \,]
    \mathcal{L} = -\sum_{i} \log p_{\theta}(t_i \mid t_{1:i-1}, H_v)

    Where:

    • x_{\text{img}} is the image and g_{\phi} the frozen vision encoder, giving patch features Z_v \in \mathbb{R}^{N \times d_v} with d_v = 1024 for ViT-L.
    • W_1, W_2 and the nonlinearity \sigma form the MLP connector, producing H_v \in \mathbb{R}^{N \times d_{\text{model}}} in the LLM embedding space.
    • H, W are image height and width, P the patch size, and r the pixel-unshuffle factor (r = 1 means no merging, r = 2 cuts tokens 4x).
    • e(\cdot) is the text embedding lookup, t_{1:m} the prompt and response tokens, and k the position of the image placeholder that H_v replaces.
    • E is the assembled input of length L = m + N - 1, and \mathcal{L} is the autoregressive loss masked to response tokens only, so no loss is computed on image positions.
    • Required initial condition: g_{\phi} must already be language-aligned (CLIP or SigLIP pretraining), otherwise stage 1 has to learn the semantics as well as the projection.
    Bar chart of image token counts and relative prefill attention cost for four vision-language configurations: 576 tokens at 1x, 1280 tokens at 4.9x, 1536 tokens at 7.1x, and 2880 tokens at 25x

    Figure 2: Higher-resolution alignment policies buy detail with sequence length, and since prefill attention is O(L^2), moving from a single 576-token view to a five-crop AnyRes layout costs about 25x the attention work per prompt.

    PropertyMLP connector (prefix tokens)Query resampler (Q-Former, Perceiver)Gated cross-attention
    Where fusion happensIn the input sequence, before layer 1In the connector, then in the input sequenceInside the decoder, at interleaved new layers
    Tokens added to the LLM sequenceOne per patch, 576 to 2,880 typicalFixed, 32 to 64 regardless of resolutionZero
    New parametersSmallest, roughly 20M for a 7B modelModerate, a small transformer plus queriesLargest, extra attention plus tanh gates in the decoder
    Prefill and KV-cache costGrows quadratically with token countNearly flat in image resolutionLinear in image features, no text-side growth
    Typical failure modeLatency and context blowup on multi-image or video promptsInformation bottleneck: weak OCR, dense counting, fine groundingHarder to train, weaker at precise pixel-level reference
    Text-only abilityCan regress once the LLM is unfrozenSame risk if the LLM is tunedPreserved by construction with a frozen LLM and zero-init gates

    Login to view more content
  • DL0109 Mixture-of-Experts MoE Routing

    Explain mixture-of-experts (MoE) and compare Sparse Mixture-of-Experts (MoE) routing strategies, as used in models like Mixtral and DeepSeek-V3.

    Answer

    A sparse mixture-of-experts layer replaces one feed-forward block with N parallel feed-forward blocks (the experts) plus a tiny linear router, and sends each token to only k \ll N of them. This is conditional computation: parameter count grows with N while the FLOPs per token grow only with k, so Mixtral 8x7B holds 46.7B parameters but activates about 12.9B per token, and DeepSeek-V3 holds 671B while activating 37B. The interesting engineering is not the experts, which are ordinary MLPs, but the routing strategy, because a learned router is free to collapse onto a few favorite experts and then most of the capacity you paid for is never trained. The dominant strategy is token-choice top-k: every token picks its own k experts, each expert has a fixed buffer set by a capacity factor, and tokens that arrive at a full expert are dropped through the residual connection. The main alternatives invert or remove that choice: expert-choice routing lets each expert select its top tokens (perfect load balance, but some tokens get no expert), hash layers assign tokens deterministically with no learned router at all, and BASE layers solve a global linear assignment per batch. The trade-off axis is always the same, namely how much balance you buy and what you pay for it in dropped tokens, extra loss terms, batch dependence, and all-to-all communication.

    (1) Parameters Decouple From FLOPs: with N=8, k=2 a token touches 25% of the expert weights, so quality scales with total parameters while latency scales with active parameters.
    (2) The Router Is One Matrix: a single d \times N projection followed by top-k selection and a renormalized softmax over the selected logits, which is why gradients reach the router only through the chosen experts.
    (3) Load Balancing Is The Central Problem: Switch-style training adds an auxiliary balance loss (typically \alpha = 0.01) and a router z-loss to keep logits small and the assignment spread out.
    (4) Capacity Factor Controls Token Dropping: a buffer of c \cdot T \cdot k / N slots per expert means c near 1.0 is cheap but discards tokens whenever the router skews.
    (5) Routing Families Differ In Who Chooses: token-choice, expert-choice, deterministic hashing, and global assignment sit on a spectrum from fully learned and imbalanced to fully balanced and inflexible.
    (6) Serving Cost Is Memory, Not Compute: every expert must be resident in HBM even though each token uses k of them, and expert parallelism adds two all-to-all collectives per MoE layer.

    Two-panel bipartite diagram: on the left, token-choice top-2 routing where four tokens each select two experts, expert one is oversubscribed and two edges are dropped at capacity; on the right, expert-choice routing where each expert selects its top two tokens, giving perfect expert load but leaving one token with no expert

    Figure 1: The two families differ in the direction of selection. Token-choice top-k guarantees every token gets k experts but not that experts get equal load, so overflow is dropped at capacity; expert-choice guarantees equal expert load but not that every token is served.

    Token-choice top-k stays the production default for autoregressive language models for one structural reason: it is a per-token function, so the routing decision for token t does not depend on any other token in the batch. Expert-choice and BASE layers both rank or match tokens against each other, which makes the forward pass batch-dependent, breaks the causal guarantee during teacher-forced training, and cannot be reproduced at decode time when the batch is a single token. Hash layers show how much of MoE’s benefit comes from capacity rather than from clever routing, since a fixed hash of the token ID is perfectly balanced by construction and still recovers a large part of the gain, but it can never learn semantic specialization. In practice the fix for token-choice imbalance is not to abandon it: DeepSeek-V3 keeps token-choice top-8 over 256 fine-grained experts, adds one always-on shared expert to absorb common knowledge, restricts each token to experts on at most 4 nodes to bound communication, and replaces the auxiliary loss with a per-expert bias that is nudged up or down to equalize load.

    Mathematical Formulation:
    h(x) = W_r x \in \mathbb{R}^{N}
    \mathcal{T}(x) = \mathrm{TopK}(h(x), k)
    g_i(x) = \frac{\exp(h_i)}{\sum_{j \in \mathcal{T}} \exp(h_j)}
    y = x + \sum_{i \in \mathcal{T}} g_i(x)\, E_i(x)
    \mathcal{L}_{\mathrm{bal}} = \alpha N \sum_{i=1}^{N} f_i P_i
    C = \left\lceil \frac{c\, T\, k}{N} \right\rceil

    Where:

    • x \in \mathbb{R}^{d} is the token hidden state and y the MoE layer output, written with the residual path that a dropped token falls back to.
    • W_r \in \mathbb{R}^{N \times d} is the router, h(x) its logits, and E_i the i-th expert MLP; N is the expert count and k the number kept.
    • \mathcal{T}(x) is the selected index set and g_i the gate weight, renormalized over the selected logits only so the weights sum to 1.
    • f_i is the fraction of tokens in the batch dispatched to expert i (piecewise constant, no gradient) and P_i the mean router probability for expert i (differentiable), so \mathcal{L}_{\mathrm{bal}} pushes probability mass away from overloaded experts.
    • \alpha is the balance-loss coefficient, commonly \alpha = 0.01; the product N \sum_i f_i P_i equals 1 under a perfectly uniform assignment and grows toward N under total collapse.
    • T is the tokens per device, c the capacity factor (usually 1.0 \leq c \leq 1.25 in training, larger at eval), and C the per-expert buffer; any token beyond C is dropped.
    Line chart of the fraction of routed tokens dropped versus capacity factor from 1.0 to 2.0 for eight experts under uniform, mildly skewed, and heavily skewed router distributions; the uniform curve is flat at zero while the heavily skewed curve stays above twenty percent even at capacity factor two

    Figure 2: Token dropping is a joint function of the capacity factor and the router’s skew. Under a balanced router, c = 1.0 drops nothing; under a collapsed router, even doubling capacity leaves a quarter of the assignments discarded, which is why the balance loss matters more than the buffer size.

    Architecture diagram of a sparse mixture-of-experts layer showing the data flow from input token through a linear router and top-k softmax selection to two selected expert FFNs out of N, with the remaining N-k non-selected experts shown folded in a dashed box, then a weighted sum with gate weights and a residual connection producing the output

    Figure 3: The full MoE layer in one picture. A single linear router produces logits over all N experts, the top-k selection picks only k of them, and the selected expert outputs are combined with renormalized gate weights and added back through the residual connection. Non-selected experts stay resident in memory but consume zero FLOPs for this token, which is why total parameters scale with N while active compute scales with k.

    PropertyToken-choice top-kExpert-choiceHash / global assignment
    Who selectsEach token picks its k highest-scoring expertsEach expert picks its C highest-scoring tokensA fixed hash of the token ID, or a linear-assignment solver over the batch
    Load balanceNot guaranteed; needs an auxiliary loss or a bias correctionExact by construction, every expert receives C tokensExact by construction, with no learned router to collapse
    Failure modeOverflow tokens are dropped to the residual and get no expert computeA token can be selected by zero experts, and tokens compete across the batchNo semantic specialization (hash) or expensive, batch-coupled solves (BASE)
    Per-token independenceYes; identical decision at batch size 1 and at batch size 1MNo; ranking couples tokens, so causal decoding does not match trainingYes for hashing, no for assignment-based methods
    Where it is usedGShard, Switch (k=1), Mixtral (k=2), DeepSeek-V3 (k=8), OLMoEEncoder-style and vision MoE, and research settings with full-sequence visibilityBaselines and ablations that isolate capacity from learned specialization

    Login to view more content
  • DL0108 PPO vs DPO vs GRPO

    Explain the architectural and mathematical differences between PPO, DPO (Direct Preference Optimization), and GRPO (Group Relative Policy Optimization).

    Answer

    All three optimize the same underlying target, maximize a preference-derived reward while staying close to a frozen reference policy, and they differ in how many networks must be resident, how the advantage is estimated, and whether the training data is sampled from the current policy. PPO is the full actor-critic loop used in InstructGPT-style RLHF: it keeps four networks (trained policy, frozen reference, frozen reward model, trained critic), samples rollouts on-policy, and updates with a clipped importance ratio against token-level GAE advantages produced by the critic. DPO deletes the RL loop entirely by inverting the closed-form solution of the KL-constrained objective: the implied reward is \beta \log(\pi_\theta / \pi_{ref}), the partition function cancels inside a Bradley-Terry pairwise likelihood, and what remains is a supervised binary-classification loss on fixed (y_w, y_l) pairs with only two networks and no sampling. GRPO keeps online sampling and the clipped surrogate but removes the critic: for each prompt it draws a group of G completions, uses the group’s mean reward as the baseline, and z-scores the rewards to get one scalar advantage that is broadcast to every token of its completion. So the axis is not “better versus worse” but which piece of machinery you are willing to pay for: PPO buys fine-grained credit assignment with a learned value function, DPO buys simplicity by giving up exploration, and GRPO buys on-policy learning with a Monte Carlo baseline.

    (1) Networks Resident: PPO needs policy, reference, reward model, and critic; GRPO drops the critic; DPO drops both the critic and the reward model.
    (2) Advantage Estimation: PPO uses GAE over a learned V_\psi, GRPO uses a group-relative z-score of sequence rewards, and DPO never forms an advantage at all, only a reward margin between two responses.
    (3) On-Policy Versus Offline: PPO and GRPO resample from the current policy every iteration, so the clip and importance ratio are meaningful; DPO trains on a static dataset and is therefore exposed to distribution shift.
    (4) KL Control: PPO and GRPO add an explicit KL penalty (GRPO commonly uses the low-variance k3 estimator), while DPO’s KL constraint is baked into the log-ratio parameterization and controlled solely by \beta.
    (5) Credit Granularity: only PPO assigns different advantages to different tokens; GRPO gives every token in a completion the same scalar, and DPO gives a whole-sequence gradient.
    (6) Where Each Fits: verifiable rewards from a checker or unit test favor GRPO, a cheap single-pass alignment on collected preferences favors DPO, and a nuanced learned reward model with long generations favors PPO.

    Three side-by-side data-flow panels: PPO with prompt, trained policy, rollout, frozen reward model plus trained critic, and GAE advantage; DPO with a static preference pair scored by the trained policy and frozen reference into a logistic loss; GRPO with a prompt, trained policy, a group of G rollouts, a frozen verifier, and a group z-scored advantage

    Figure 1: The three objectives differ mainly in what sits between the policy and the loss: PPO inserts a reward model plus a trained critic, GRPO replaces the critic with a group of sampled rollouts, and DPO removes the sampling stage so the frozen reference is the only extra network.

    DPO’s derivation is what makes the contrast precise. The KL-constrained bandit objective has the closed-form optimum \pi^*(y \mid x) \propto \pi_{ref}(y \mid x) \exp(r(x,y)/\beta); solving for the reward gives r = \beta \log(\pi^*/\pi_{ref}) + \beta \log Z(x), and because the Bradley-Terry likelihood depends only on reward differences for the same prompt, the intractable partition function Z(x) cancels. The reward model therefore never has to be materialized, since its optimal policy is the object you were going to train anyway. The price is that this equivalence is exact only when the preference pairs come from \pi_{ref}; on off-policy pairs the loss can raise the margin while pushing down the probability of the chosen response as well, the failure mode usually called likelihood displacement. GRPO takes the opposite trade, keeping the on-policy ratio and clip but swapping the critic’s learned variance reduction for a Monte Carlo baseline over G samples of the same prompt, which is cheap and well-behaved when the reward is a verifiable 0/1 signal from a math checker or unit test. That is exactly the regime DeepSeek used when introducing GRPO for DeepSeekMath and then scaling it for R1.

    Mathematical Formulation:
    r_t(\theta) = \frac{\pi_\theta(a_t \mid s_t)}{\pi_{old}(a_t \mid s_t)}
    \tilde r_t = \mathrm{clip}(r_t, 1 - \epsilon, 1 + \epsilon)
    \mathcal{L}_{PPO} = -\mathbb{E}\left[\min(r_t A_t,\ \tilde r_t A_t)\right]
    A_t = \sum_{l \geq 0} (\gamma \lambda)^l \delta_{t+l}
    \delta_t = R_t + \gamma V_\psi(s_{t+1}) - V_\psi(s_t)
    \hat r_\theta(x, y) = \beta \log \frac{\pi_\theta(y \mid x)}{\pi_{ref}(y \mid x)}
    \Delta = \hat r_\theta(x, y_w) - \hat r_\theta(x, y_l)
    \mathcal{L}_{DPO} = -\mathbb{E}\left[\log \sigma(\Delta)\right]
    A_i = \frac{R_i - \mathrm{mean}(R_{1:G})}{\mathrm{std}(R_{1:G})}
    \mathcal{L}_{GRPO} = -\mathbb{E}\left[\min(r_i A_i,\ \tilde r_i A_i)\right]
    \qquad + \beta \, \mathbb{D}_{KL}\left[\pi_\theta \,\|\, \pi_{ref}\right]

    Where:

    • \pi_\theta is the trained policy, \pi_{ref} the frozen reference (normally the SFT checkpoint), and \pi_{old} the policy that generated the current batch of rollouts.
    • s_t is the prompt-plus-prefix state and a_t the token emitted at position t; R_t is the per-step reward, which in RLHF is usually nonzero only at the final token.
    • V_\psi is the learned critic, \delta_t the TD residual, and A_t the GAE advantage with discount \gamma and trace decay \lambda.
    • \epsilon is the clip half-width (typically 0.1 to 0.2) and \beta is the KL coefficient in PPO and GRPO, or the implicit-reward temperature in DPO (typically 0.01 to 0.5).
    • y_w and y_l are the preferred and rejected responses for prompt x, \sigma is the logistic function, and \hat r_\theta is the reward implied by the policy itself.
    • i \in \{1, \ldots, G\} indexes the group of completions sampled per prompt (commonly G = 8 to 64), R_i is its sequence-level reward, and A_i is shared by every token of completion i.
    • Required initial condition in all three: \pi_\theta is initialized from \pi_{ref}, otherwise the KL term and the log-ratio reward have no meaningful anchor.
    Stacked bar chart of resident bf16 weight memory for a 7B policy: PPO 56 GB with 28 GB trained, GRPO with a reward model 42 GB with 14 GB trained, GRPO with a rule verifier 28 GB, and DPO 28 GB with 14 GB trained

    Figure 2: Counting only weights at 7B scale in bf16, PPO holds four copies and trains two of them, so its Adam state is roughly double GRPO’s; a rule-based verifier removes the reward model entirely, making GRPO as light as DPO in weight memory while still sampling online.

    PropertyPPODPOGRPO
    Networks residentPolicy, reference, reward model, critic (two trained)Policy and frozen reference (one trained)Policy, reference, reward model or verifier (one trained)
    Data sourceFresh on-policy rollouts from promptsStatic offline preference pairs, no generationGroups of G on-policy rollouts per prompt
    Baseline for the gradientLearned value function, GAE per tokenThe rejected response acts as the baselineGroup mean reward, normalized by group std
    Credit granularityPer token, values differ along the sequenceWhole sequence, one margin per pairOne scalar per completion, broadcast to all its tokens
    KL controlExplicit penalty or reward shaping, often adaptiveImplicit in the log-ratio, tuned only through betaExplicit term with the k3 estimator, sometimes dropped
    Cost per updateHighest: generation plus four forward passes plus critic trainingLowest: two forward passes on cached textGeneration dominates, G completions per prompt
    Main failure modeCritic instability and reward hacking, many coupled hyperparametersOff-policy shift and likelihood displacement on unseen responsesDegenerate groups with zero reward variance, length and difficulty bias

    Login to view more content
  • DL0107 Multi-head Latent Attention MLA

    Explain Multi-head Latent Attention (MLA), as used in DeepSeek-V2 and DeepSeek-V3.

    Answer

    Multi-head Latent Attention (MLA) attacks the KV-cache bottleneck of autoregressive decoding by low-rank joint compression of keys and values instead of by deleting KV heads. Each token is projected down to a single shared latent vector c_t^{KV} of dimension d_c = 512, and that latent is the only thing cached; per-head keys and values are reconstructed on the fly by up-projection matrices W_i^{UK} and W_i^{UV}, so every head still gets its own distinct K and V, unlike GQA and MQA which force heads to share. Because RoPE does not commute with the up-projection, MLA adds a small decoupled RoPE key of dimension d_h^R = 64 that is shared across heads and cached directly, giving a total cache of 512 + 64 = 576 values per token per layer against 2 \cdot 128 \cdot 128 = 32{,}768 for the equivalent MHA configuration, a roughly 57x reduction. The reason this is not simply lossy compression is the absorption trick: at inference the up-projections fold into the query and output projections, so the model never materializes the full keys and values, and the attention score becomes a bilinear form on the two latents. The result reported in DeepSeek-V2 is unusual for a cache-reduction technique, since MLA matched or beat full MHA on benchmarks while caching about 1/57 as much, which is why DeepSeek-V3 kept it unchanged at 61 layers and 128 heads.

    (1) Joint Low-Rank KV Compression: one down-projection produces a single latent per token that serves all heads and both K and V, so cache cost is (d_c + d_h^R) \cdot l rather than 2 n_h d_h l.
    (2) Head Diversity Is Preserved: per-head up-projections mean MLA reduces cache without reducing the number of effective K/V heads, which is the quality cost GQA and MQA pay.
    (3) Decoupled RoPE Path: position information travels in a separate small key dimension because applying RoPE inside the compressed path would make the up-projection position-dependent and destroy absorption.
    (4) Absorption At Inference: W_i^{UK} folds into W_i^{UQ} and W_i^{UV} folds into W^O, so decoding reads only the cached latent and never reconstructs full K or V tensors.
    (5) Query Compression Is A Separate Win: queries are also routed through a latent of dimension 1536, which cuts training activation memory but has no effect on the KV cache.
    (6) Memory-Bandwidth Trade For FLOPs: the absorbed score is a dot product over 576 dimensions instead of 128, so MLA raises arithmetic intensity, exactly the right direction for memory-bound batch decoding.

    MLA architecture diagram: the hidden state is projected into a query latent, a shared 512-dimensional KV latent that is cached, and a 64-dimensional decoupled RoPE key that is also cached; per-head keys and values are reconstructed by up-projections and attention runs over a 192-dimensional concatenated head

    Figure 1: Only the two boxes inside the dashed region enter the cache: the 512-dimensional KV latent and the 64-dimensional decoupled RoPE key. Per-head keys and values are reconstructed from the latent, and at inference those up-projections are absorbed so they are never computed explicitly.

    The decoupled RoPE dimension is the part candidates most often miss, and it follows from a single algebraic fact. The score between query t and key j in the compressed path is (W_i^{UQ} c_t^{Q})^\top (W_i^{UK} c_j^{KV}), which lets you precompute the constant matrix M_i = (W_i^{UQ})^\top W_i^{UK}. If RoPE were applied to k_j^C, that matrix would become (W_i^{UQ})^\top R_{t-j} W_i^{UK}, which depends on the relative position and therefore differs for every cached token, so nothing can be precomputed and every prefix key would have to be rebuilt at each step. MLA sidesteps this by carrying position in a separate 64-dimensional key that is cached in rotated form and shared by all heads, so the query concatenates a 128-dimensional content part with a 64-dimensional positional part, giving an effective head dimension of 192 during training. A practical consequence is that the value head dimension (128) differs from the query and key dimension (192), which is why MLA needs purpose-built kernels such as FlashMLA rather than a stock FlashAttention call.

    Mathematical Formulation:
    c_t^{KV} = W^{DKV} h_t
    k_{t,i}^C = W_i^{UK} c_t^{KV}
    v_{t,i}^C = W_i^{UV} c_t^{KV}
    k_t^R = \mathrm{RoPE}(W^{KR} h_t)
    q_{t,i} = [\,q_{t,i}^C ; q_{t,i}^R\,]
    k_{t,i} = [\,k_{t,i}^C ; k_t^R\,]
    (q_{t,i}^C)^\top k_{j,i}^C = (c_t^{Q})^\top M_i c_j^{KV}
    M_i = (W_i^{UQ})^\top W_i^{UK}
    d_c + d_h^R = 512 + 64 = 576

    Where:

    • c_t^{KV} \in \mathbb{R}^{d_c} is the cached KV latent and k_t^R \in \mathbb{R}^{d_h^R} the cached decoupled RoPE key; together they are the entire per-token cache.
    • h_t \in \mathbb{R}^{d} is the layer input (d = 7168 in DeepSeek-V3), and c_t^{Q} is the query latent of dimension 1536.
    • t indexes the current token, j ranges over cached prefix positions with j \leq t, and i \in \{1,\ldots,n_h\} indexes the n_h = 128 heads.
    • d_h = 128 is the content head dimension, d_h^R = 64 the positional dimension, so the concatenated query and key have dimension 192 while values keep 128.
    • W^{DKV}, W^{DQ} are down-projections, W_i^{UK}, W_i^{UV}, W_i^{UQ} up-projections, W^{KR}, W^{QR} the RoPE-path projections, and W^O the output projection.
    • M_i is the absorbed score matrix, valid only because no rotation sits between the two up-projections; \mathrm{RoPE} applies the rotary transform, and [\,\cdot;\cdot\,] denotes concatenation.
    Log-scale bar chart of KV cache per token per layer: MHA with 128 KV heads at 32768 values and 524 GB at 128K context, GQA with 8 groups at 2048 values and 32.8 GB, MLA at 576 values and 9.2 GB, MQA at 256 values and 4.1 GB

    Figure 2: Totals assume 61 layers, bf16, and a 128K-token context. MLA lands between MQA and 8-group GQA on cache size, but reaches that point by compressing rather than by removing KV heads, which is why it does not carry their quality penalty.

    PropertyMLAGQA (8 groups)MQA
    What is cachedOne 512-dim latent plus a 64-dim RoPE keyFull K and V for 8 shared KV headsFull K and V for a single KV head
    Values per token per layer5762,048256
    Effective K/V per headDistinct for all 128 heads, reconstructed by up-projection16 query heads share one K and VAll 128 query heads share one K and V
    Decode compute per keyDot product over 576 dims after absorption, higher FLOPs128 dims, plus broadcast of shared heads128 dims, lowest FLOPs
    Kernel and tooling supportNeeds custom kernels (FlashMLA) because query/key is 192 and value is 128Supported by every stock attention kernelSupported by every stock attention kernel
    Tensor-parallel behaviorLatent is shared by all heads, so it is replicated per rankKV heads shard cleanly across ranksSingle KV head must be replicated
    Quality relative to MHAMatched or slightly better in the DeepSeek-V2 ablationsSmall but measurable degradationLargest degradation, especially on long context

    Login to view more content
  • DL0106 Stable Diffusion Architecture

    Explain the key components of the Stable Diffusion architecture and how they interact during image generation.

    Answer

    Stable Diffusion is three separately trained networks plus one training-free sampler, and only one of the three is trained on the diffusion objective. A frozen KL-regularized VAE maps a 512 \times 512 \times 3 image to a 64 \times 64 \times 4 latent and back; a frozen CLIP text encoder turns the prompt into a 77 \times 768 sequence of token embeddings; and a conditional U-Net (860M parameters in SD 1.5) predicts the noise present in a noisy latent, given the timestep and the text context. At generation time the sampler starts from z_T \sim \mathcal{N}(0, I) on the latent grid and repeats a fixed loop: call the U-Net, combine the conditional and unconditional predictions with classifier-free guidance, then let the scheduler (DDIM, Euler, DPM-Solver) take one step of the reverse process. After 20 to 50 such steps the VAE decoder is called exactly once to turn the final latent into pixels, so the full path is encode → denoise → decode with the text encoder feeding every denoising step through cross-attention.

    (1) VAE Codec: a convolutional encoder and decoder pair, frozen after stage-one training with an L1 plus LPIPS plus patch-GAN objective, that removes imperceptible high-frequency detail so the denoiser works on 16,384 values instead of 786,432.
    (2) Text Encoder: CLIP ViT-L/14’s transformer, frozen, producing per-token hidden states rather than a single pooled vector, which is what makes word-level prompt control possible.
    (3) U-Net Denoiser: the only trained diffusion component, built from ResBlocks that receive a sinusoidal timestep embedding through a learned projection added to their feature maps, interleaved with transformer blocks.
    (4) Cross-Attention Is The Conditioning Interface: queries come from the latent feature map, keys and values come from the text context, so the prompt influences the image at 16 separate points in SD 1.5’s U-Net.
    (5) Scheduler: not a network at all but a numerical solver for the reverse SDE or probability-flow ODE, which is why you can swap samplers and step counts on a trained checkpoint without retraining.
    (6) Classifier-Free Guidance: each step runs the U-Net twice, once with the prompt and once with the empty string, and extrapolates between them, which doubles the per-step cost and is the main knob for prompt adherence.

    Block diagram of Stable Diffusion generation: a text prompt enters a frozen CLIP text encoder producing a 77 by 768 context that feeds cross-attention in the U-Net denoiser; starting from Gaussian noise in a 64 by 64 by 4 latent, the U-Net output passes through classifier-free guidance and a scheduler step, loops for 20 to 50 steps, and the final latent is decoded once by the frozen VAE decoder into a 512 by 512 image

    Figure 1: The loop is the architecture. The U-Net is evaluated twice per step for guidance, the text encoder runs once for the whole generation, and the decoder runs once at the end; everything inside the loop stays on the small latent grid.

    Inside the U-Net the latent descends a resolution ladder, 64 \rightarrow 32 \rightarrow 16 \rightarrow 8, with channel widths 320, 640, 1280, 1280, and climbs back up with skip concatenations from the matching encoder level. Attention is deliberately not applied everywhere: in SD 1.5 the transformer blocks sit at the 64, 32, and 16 levels plus the mid block, and the deepest 8 \times 8 level is pure convolution, because self-attention cost grows as O(N^2) in the token count and the highest-resolution level already carries 4,096 tokens. SDXL rebalances exactly this: it drops attention at the finest level entirely and stacks far more transformer blocks at 32 and 16, which is how it reaches 2.6B parameters while remaining trainable at 1024 \times 1024. Each transformer block is self-attention, then cross-attention, then a GEGLU feed-forward, so spatial coherence and prompt alignment are handled by two different mechanisms in the same block.

    U-shaped diagram of the SD 1.5 denoiser: four downsampling levels at 64 by 64 with 320 channels, 32 by 32 with 640, 16 by 16 with 1280 and 8 by 8 with 1280, a mid block with attention, and four upsampling levels, with dashed skip-concatenation links between matching levels and attention marked at the top three levels and the mid block only

    Figure 2: The SD 1.5 U-Net applies self-attention and cross-attention at three of four resolutions and leaves the deepest 8 \times 8 level convolution-only; skip concatenations carry high-frequency structure past the bottleneck so the decoder path can restore fine detail.

    Mathematical Formulation:
    z_T \sim \mathcal{N}(0, I)
    Q = W_Q\,\varphi(z_t)
    K = W_K\,\tau(y)
    V = W_V\,\tau(y)
    \mathrm{Attn} = \mathrm{softmax}\!\left(\frac{QK^{\top}}{\sqrt{d}}\right)V
    \hat{\epsilon}_t = \epsilon_u + s\,(\epsilon_c - \epsilon_u)
    z_{t-1} = \mathrm{Step}(z_t, \hat{\epsilon}_t, t)
    \hat{x} = \mathcal{D}(z_0 / s_z)

    Where:

    • z_t \in \mathbb{R}^{64 \times 64 \times 4} is the latent at timestep t, and \hat{x} is the decoded image.
    • \varphi(z_t) is the flattened spatial feature map entering a transformer block, and \tau(y) is the frozen CLIP context of shape 77 \times 768.
    • W_Q, W_K, W_V are the per-layer projections and d is the head dimension; queries carry image content while keys and values carry text.
    • \epsilon_c = \epsilon_\theta(z_t, t, \tau(y)) and \epsilon_u = \epsilon_\theta(z_t, t, \tau(\varnothing)) are the conditional and unconditional noise predictions, and s is the guidance scale (typically 5 \leq s \leq 9).
    • \mathrm{Step} is the scheduler update (DDIM, Euler, DPM-Solver), applied for t descending over the chosen 20 to 50 timesteps.
    • \mathcal{D} is the frozen VAE decoder and s_z = 0.18215 the latent scaling constant; the required initial condition is z_T \sim \mathcal{N}(0, I), which only holds because s_z normalizes the latent variance.
    ComponentSD 1.5SDXLSD3 / Flux
    Latent codecKL-VAE, f = 8, 4 channels, about 84M parametersRetrained f = 8 VAE, still 4 channelsf = 8 VAE widened to 16 channels
    Text encoderCLIP ViT-L/14, 77 x 768 contextCLIP ViT-L plus OpenCLIP ViT-bigG, concatenated to 77 x 2048 plus a pooled vectorCLIP-L, CLIP-G and T5-XXL, giving long-prompt and typography understanding
    DenoiserU-Net, 860M, attention at 64, 32 and 16U-Net, 2.6B, no attention at the finest level, deep transformer stacks at 32 and 16MMDiT transformer, 2B to 12B, no convolutional U-Net at all
    Conditioning pathCross-attention in 16 transformer blocksCross-attention plus pooled text, original size and crop coordinates added to the timestep embeddingJoint self-attention over concatenated text and image tokens, with separate weights per modality
    Objective and native resolutionEpsilon-prediction, 512 x 512Epsilon-prediction base with a v-prediction refiner, 1024 x 1024Rectified flow matching, 1024 x 1024 with multi-aspect buckets

    Login to view more content
  • DL0105 DiT: Diffusion Transformers

    What is the core architectural innovation of Diffusion Transformers (DiT) compared to traditional U-Net-based diffusion models?

    Answer

    The core innovation is mostly subtractive: DiT deletes the multi-scale convolutional U-Net and replaces it with a plain ViT-style transformer that runs on a flat sequence of latent patch tokens at constant resolution and constant width, with no downsampling, no upsampling, and no encoder-decoder skip connections. A 32 \times 32 \times 4 latent from an 8x VAE is cut into non-overlapping p \times p patches (p = 2 gives 256 tokens), linearly projected to width d, given positional embeddings, and pushed through N identical blocks. The only diffusion-specific machinery left is how conditioning enters: adaLN-Zero regresses a per-block scale, shift, and residual gate from the summed timestep and class embeddings, with the gate initialized to zero so each block starts as an identity map. Because the backbone is isotropic, sample quality becomes a smooth function of transformer Gflops rather than of hand-tuned channel schedules, and DiT-XL/2 (28 blocks, width 1152, 675M parameters, 118.6 Gflops) reached FID 2.27 with classifier-free guidance on ImageNet 256 \times 256 after 7M training steps, ahead of the U-Net LDM and ADM baselines. That predictable scaling, plus the ability to reuse ordinary transformer infrastructure, is why later systems such as Stable Diffusion 3 and video generators adopted DiT-style backbones.

    (1) Isotropic Token Stack: patchify once, then keep the sequence length and hidden width fixed through every block, so there is no multi-scale hierarchy and no skip connections to carry high-frequency detail.
    (2) adaLN-Zero Conditioning: timestep and class are injected by modulating LayerNorm and gating the residual branch instead of through cross-attention or extra input channels, and the zero-initialized gate makes a 28-block stack start as the identity.
    (3) Patch Size Is A Compute Knob: halving p quadruples the token count and roughly quadruples backbone Gflops without adding parameters, which makes compute and capacity independently tunable.
    (4) Quality Tracks Gflops: FID decreases monotonically with backbone Gflops across model sizes and patch sizes, so a smaller model with small patches can beat a larger model with large patches.
    (5) Infrastructure Reuse: the backbone is a standard transformer, so FlashAttention, sequence and tensor parallelism, and spatiotemporal patching for video all transfer directly from the LLM and ViT ecosystem.

    Side-by-side diagram: on the left a U-Net with three encoder ResBlocks descending in resolution, a mid block, three upsampling decoder blocks and dashed skip connections; on the right a DiT stack of patchify, 28 DiT blocks with adaLN-Zero conditioning, and a final linear unpatchify layer

    Figure 1: The U-Net spends parameters on a resolution pyramid with skip connections, while DiT keeps one token sequence at fixed width and pushes all conditioning through adaLN-Zero modulation of each block.

    The conditioning choice was not incidental. The DiT paper ablated four options at matched compute: in-context conditioning (append timestep and class as extra tokens), cross-attention to a two-token condition sequence, plain adaptive LayerNorm, and adaLN-Zero. The ranking was consistent, with adaLN-Zero best, then adaLN, then cross-attention, then in-context, and adaLN-Zero also added the fewest Gflops because it needs no extra tokens or extra attention operation. The zero-initialized gate matters because a deep residual stack whose blocks all start as identity behaves like a shallow network early in training, which is the same trick that stabilizes very deep ResNets and ViTs. The cost of dropping skip connections is that all high-frequency reconstruction has to be learned inside the token stack and by the VAE decoder, which is one reason DiT operates in a compressed latent space rather than on raw pixels.

    Mathematical Formulation:
    T = \frac{H}{p} \cdot \frac{W}{p}
    c = \mathrm{emb}(t) + \mathrm{emb}(y)
    (\gamma_i, \beta_i, \alpha_i) = \mathrm{MLP}_i(c)
    \hat{z} = (1 + \gamma_1)\,\mathrm{LN}(z) + \beta_1
    z \leftarrow z + \alpha_1\,\mathrm{MSA}(\hat{z})
    \mathcal{C}_{\mathrm{attn}} = O(T^2 d)

    Where:

    • T is the token count after patchifying a latent of spatial size H \times W with patch size p; for H = W = 32 and p = 2 this gives T = 256.
    • c is the pooled conditioning vector built from the diffusion timestep t and the class or text embedding y.
    • \gamma_i, \beta_i are the scale and shift applied to the normalized activations of sub-layer i, and \alpha_i is the residual gate; i \in \{1, 2\} indexes the attention and feed-forward sub-layers.
    • z \in \mathbb{R}^{T \times d} is the token sequence, \mathrm{LN} is LayerNorm without learnable affine parameters, and \mathrm{MSA} is multi-head self-attention (the feed-forward sub-layer uses \gamma_2, \beta_2, \alpha_2 identically).
    • \mathcal{C}_{\mathrm{attn}} is the per-layer attention cost, quadratic in T and therefore quartic in the inverse patch size.
    • Required initial condition: \alpha_1 = \alpha_2 = 0 at step 0, so every block is an identity map and the residual stream passes through unchanged.
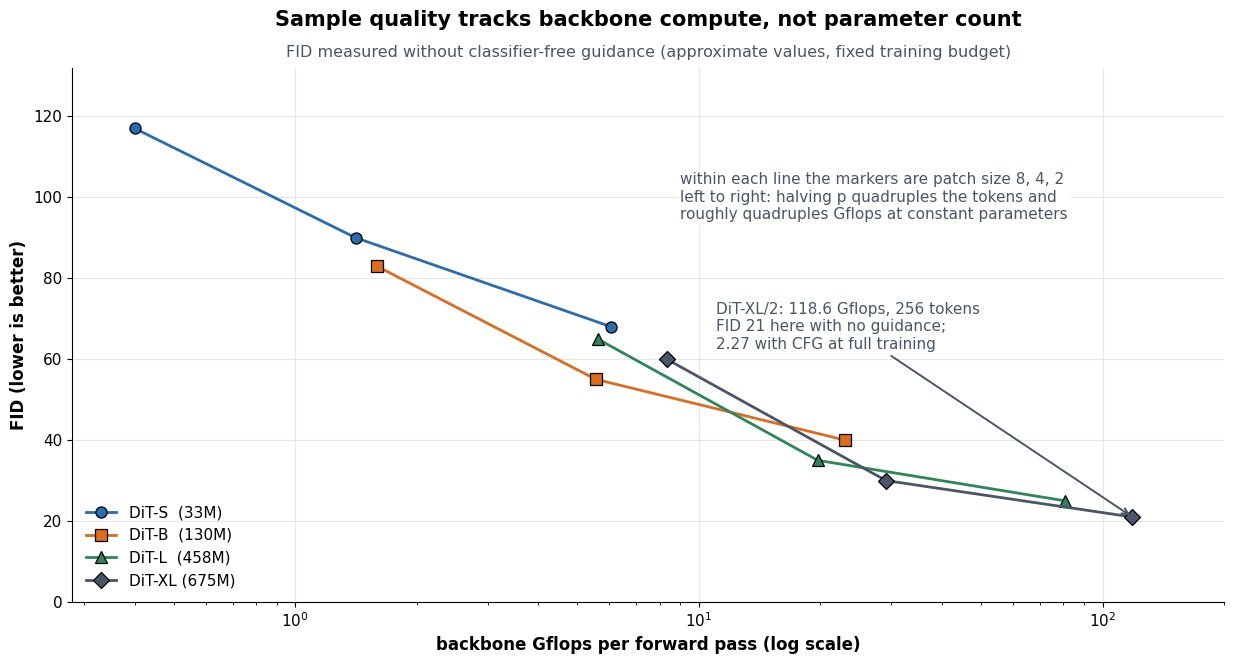
    Log-x line chart of FID against backbone Gflops for DiT-S, DiT-B, DiT-L and DiT-XL, each line connecting patch sizes 8, 4 and 2, showing FID falling monotonically as Gflops rise

    Figure 2: Approximate FID against backbone Gflops at a fixed 400K-step training budget and without classifier-free guidance, which is why the absolute values sit far above the guided FID 2.27 quoted for the fully trained DiT-XL/2. What matters here is the trend: quality tracks compute rather than parameter count, so DiT-B with p = 2 can outrun DiT-L with p = 8 despite having far fewer parameters.

    PropertyDiTU-Net (ADM, LDM, SDXL)
    Spatial handlingOne fixed-length token sequence, no resampling and no skipsResolution pyramid 32 → 16 → 8 → 4 → 8 → 16 → 32 with skip connections
    Conditioning pathadaLN-Zero: per-block scale, shift, and zero-initialized residual gate from cTimestep embedding added inside ResBlocks, text or class via cross-attention
    Compute knobsDepth, width, and patch size; patch size changes Gflops at constant parametersChannel multipliers, blocks per level, and which levels get attention
    Inductive biasMinimal beyond positional embeddings, so it needs more data and compute to pay offStrong locality and multi-scale bias, sample-efficient at small budgets
    Cost as resolution growsO(T^2 d) attention, so latent compression and patch size are load-bearingConvolutions grow linearly in pixels; attention only at low-resolution levels
    Scaling behaviorFID a smooth decreasing function of Gflops, easy to extrapolateGains depend on hand-designed schedules and saturate less predictably

    One caveat when quoting numbers in an interview: FID is only comparable within a fixed evaluation protocol. The headline 2.27 comes from the fully trained DiT-XL/2 sampled with classifier-free guidance at scale 1.5; the same checkpoint sampled without guidance lands near 9.6, and the scaling sweep above uses a much shorter 400K-step budget with no guidance at all. Guidance, training steps, sampler, and step count all move the number by more than the architectural gap being discussed, so state the protocol alongside the score.


    Login to view more content
  • DL0103 Stable Diffusion Latent Space

    What is latent diffusion, and why does Stable Diffusion run diffusion in a VAE latent space?

    Answer

    Latent diffusion splits image generation into two stages that are trained separately: a convolutional autoencoder first compresses pixels into a small spatial latent, and the diffusion model then learns the noise process entirely inside that latent grid. Stable Diffusion uses a KL-regularized VAE with downsampling factor f = 8, so a 512 \times 512 \times 3 image becomes a 64 \times 64 \times 4 latent: 786,432 values collapse to 16,384, a 48x reduction in the tensor the U-Net has to denoise. The motivation is that the two stages solve different problems. Pixel-space diffusion wastes most of its capacity and most of its training steps modeling imperceptible high-frequency detail, exactly the information a perceptual codec throws away for free; the autoencoder handles that perceptual compression once, and the diffusion model is left with the semantic compression problem of arranging layout, objects, and style. The compute argument is even stronger than the 48x suggests, because the U-Net contains self-attention: token count drops from 262,144 to 4,096, so any O(N^2) attention block gets f^4 = 4096 times cheaper. That is what turned high-resolution text-to-image training from a large-cluster project into something reproducible on modest hardware, and what makes 50-step sampling on a consumer GPU feasible at all.

    (1) Two-Stage Factorization: the autoencoder is trained first and then frozen; the diffusion model never sees a pixel, and the decoder is invoked exactly once at the end of sampling.
    (2) Quadratic Savings On Attention: the latent grid has f^2 fewer positions, so convolutions get f^2 cheaper and self-attention gets roughly f^4 cheaper.
    (3) It Is Not A Generative VAE: the KL weight is tiny (on the order of 10^{-6}) and the reconstruction loss adds LPIPS plus a patch discriminator, so the encoder behaves as a sharp lossy codec rather than a prior you would ever sample from.
    (4) Latent Scaling Matters: encoder outputs are multiplied by a constant (0.18215 for SD 1.x, 0.13025 for SDXL) so the latent has roughly unit variance and the standard noise schedule reaches a true \mathcal{N}(0, I) terminal state.
    (5) Cheap Conditioning And Editing: CLIP text embeddings enter through cross-attention at every latent resolution, and img2img, inpainting, and ControlNet all operate on the same small latent grid.
    (6) The Decoder Is The Fidelity Ceiling: nothing the diffusion model does can recover detail the 4-channel latent discarded, which is why small text, fine textures, and tiny faces degrade first.

    Pipeline diagram: a 512 by 512 by 3 image enters a VAE encoder producing a 64 by 64 by 4 latent, an iterative denoising U-Net conditioned by CLIP text cross-attention operates on the latent for T steps, and a VAE decoder maps the result back to pixels

    Figure 1: Training and sampling both live in the 4,096-token latent grid; the frozen encoder and decoder are the only components that ever touch the 262,144-pixel image, and text conditioning enters the denoiser through cross-attention.

    The choice of f is a genuine trade-off rather than a free win. The original LDM ablations show that f \in \{4, 8\} is the sweet spot: at f = 1 or 2 training is slow because the model is still doing perceptual compression itself, while at f = 32 with only 4 channels the autoencoder becomes the bottleneck and sample quality saturates no matter how long the diffusion model trains. Channel count c is the other lever, and it is the one that later models moved: SD3 and Flux keep f = 8 but raise the latent to 16 channels, quartering the compression ratio from 48 to 12 to trade a little step cost for a much better reconstruction ceiling on text and fine structure. A practical consequence of the frozen-codec design is that latents are model-specific: an SDXL latent decoded by an SD 1.5 decoder produces color-shifted garbage, because the two autoencoders were trained with different scaling and channel statistics.

    Mathematical Formulation:
    z_0 = s \cdot \mathcal{E}(x)
    \hat{x} = \mathcal{D}(z_0 / s)
    z_t = \sqrt{\bar\alpha_t}\, z_0 + \sqrt{1 - \bar\alpha_t}\, \epsilon
    \mathcal{L} = \mathbb{E}\left[\lVert \epsilon - \epsilon_\theta(z_t, t, \tau(y)) \rVert_2^2\right]
    \rho = \frac{3 f^2}{c}
    \rho = \frac{3 \cdot 64}{4} = 48

    Where:

    • x \in \mathbb{R}^{H \times W \times 3} is the image and \hat{x} its reconstruction; z_0 \in \mathbb{R}^{h \times w \times c} is the clean latent with h = H/f and w = W/f.
    • \mathcal{E} and \mathcal{D} are the frozen VAE encoder and decoder, and s is the latent scaling constant that normalizes the variance.
    • t \in \{1, \ldots, T\} is the timestep, \bar\alpha_t the cumulative noise schedule, and \epsilon \sim \mathcal{N}(0, I) the sampled Gaussian noise.
    • \epsilon_\theta is the latent denoiser (U-Net in SD 1.x and SDXL, a transformer in DiT-style successors), and \tau(y) is the text-encoder output injected by cross-attention.
    • f is the spatial downsampling factor and c the latent channel count; \rho is the element compression ratio, which is 48 for f = 8, c = 4 and 12 for c = 16.
    • Required initial condition at sampling: z_T \sim \mathcal{N}(0, I) on the latent grid, which only holds if s was applied and \bar\alpha_T \approx 0.
    Log-scale bar chart of self-attention cost reduction relative to pixel space at 512 by 512 resolution: factor 1 for pixel space with 262144 tokens, 256 for f equals 4, 4096 for f equals 8, and 65536 for f equals 16

    Figure 2: Because self-attention scales as O(N^2) in the token count, compressing by f cuts attention cost by f^4; the f = 8 setting used by Stable Diffusion buys a 4096x reduction while keeping the decoder’s reconstruction error acceptable.

    PropertyLatent diffusion (Stable Diffusion)Single-stage pixel diffusionCascaded pixel diffusion
    Where noise is addedA 64x64x4 VAE latentDirectly on RGB pixels at full resolutionPixels at 64×64, then two super-resolution diffusion stages
    Denoiser input size at 512×5124,096 tokens, 16,384 values262,144 tokens, 786,432 values4,096 tokens in the base model, full resolution in the last upsampler
    Training and sampling costLowest; one model, attention roughly 4096x cheaper per blockHighest; attention is usually dropped or windowed to stay tractableModerate but multiplied by the number of stages
    Fidelity ceilingBounded by decoder reconstruction error, independent of training lengthNo codec bottleneck; exact pixel modeling is possibleNo codec bottleneck, but upsamplers can hallucinate detail
    Typical failure modeMangled small text, smeared fine texture, artifacts on tiny facesUnder-trained global structure for a fixed compute budgetError accumulation and train/test mismatch between stages

    Login to view more content
  • DL0099 Masked Autoencoding MAE

    What is masked autoencoding (MAE, or masked language modeling) as a representation learning objective?

    Answer

    Masked autoencoding is a denoising self-supervised objective: hide a random subset of the input units, then train the network to reconstruct exactly what was hidden from the surviving context. The supervision is free because the labels are the withheld input itself, and the representation quality comes from the fact that reconstruction cannot be solved by copying: predicting a masked word or a masked image region requires the encoder to carry semantic, long-range context in its hidden states. BERT-style masked language modeling is the discrete version, masking about 15% of tokens and predicting a softmax over the vocabulary at those positions. MAE is the continuous vision version, masking about 75% of image patches and regressing raw pixels with an asymmetric encoder-decoder: a deep ViT encoder that only ever sees the visible 25% of patches, plus a shallow decoder that is discarded after pretraining. That asymmetry is what makes it cheap, and it scales: a ViT-Huge pretrained with MAE on ImageNet-1K alone reaches 87.8% top-1 after fine-tuning, with over 3x faster pretraining than a full-token baseline.

    (1) Masking Manufactures The Labels: no annotation is required, so the objective scales with raw data; the only design decisions are what to mask, how much, and what target to regress or classify.
    (2) Asymmetric Encoder-Decoder: the encoder processes only unmasked tokens and mask tokens enter at the decoder, so both compute and the pretrain-finetune input mismatch shrink dramatically.
    (3) Masking Ratio Tracks Information Density: text is dense and semantic so 15% suffices, while adjacent pixels are highly redundant and need 75% before the task stops being local interpolation.
    (4) The Target Defines The Representation: raw pixels, per-patch normalized pixels, discrete VQ tokens (BEiT), or latent teacher features (data2vec) all train the same encoder toward different levels of abstraction.
    (5) Strong Fine-Tuning, Weak Linear Probing: MAE features are highly non-linear, so they beat contrastive methods after fine-tuning but lag them under a frozen linear probe or k-NN retrieval.

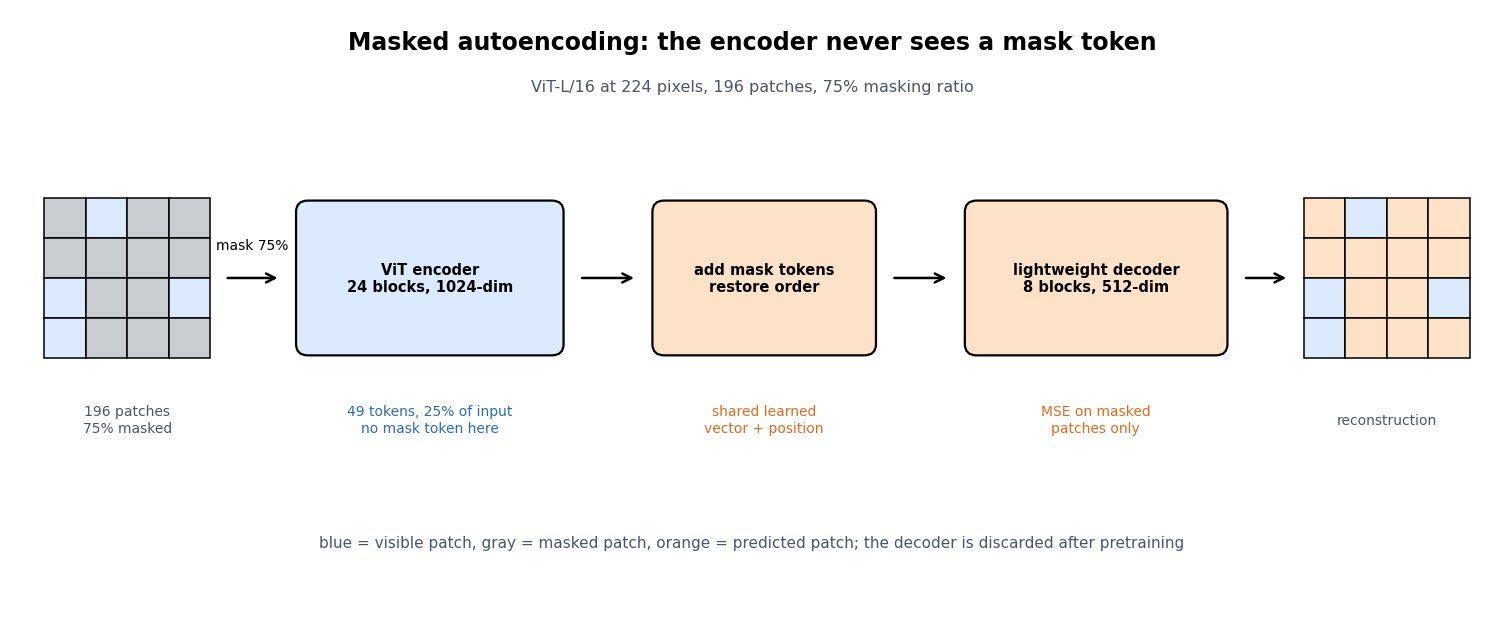
    Flow diagram of the MAE pipeline: a 4 by 4 patch grid with 75 percent of cells masked, an arrow into a ViT encoder that processes only the 49 visible tokens, then a block that inserts mask tokens and restores order, then a lightweight 8-block decoder, then the reconstructed patch grid

    Figure 1: The MAE pipeline for a ViT-L/16 at 224 pixels: of 196 patches only 49 reach the encoder, mask tokens are inserted just before a shallow decoder, and the MSE loss is computed on masked patches only.

    Two details separate the text and vision instantiations. BERT cannot drop masked positions because the prediction head must sit at those positions, so the literal [MASK] symbol is fed to the encoder during pretraining and never appears at fine-tuning time; the original recipe patches this discrepancy by replacing only 80% of selected tokens with [MASK], 10% with a random token, and leaving 10% unchanged. MAE removes the problem structurally: masked patches are simply deleted from the encoder’s input sequence, and the mask token is a learned vector injected at the decoder. The second detail is the loss support. Computing the reconstruction error on masked patches only matters, since including visible patches lets the model spend capacity on an identity mapping and measurably hurts downstream accuracy.

    Mathematical Formulation:
    \mathcal{L}_{\mathrm{MLM}} = -\sum_{i \in \mathcal{M}} \log p_{\theta}(x_i \mid \tilde{x})
    \hat{x} = D\big(E(x_{\mathcal{V}}), m\big)
    \mathcal{L}_{\mathrm{MAE}} = \frac{1}{|\mathcal{M}|} \sum_{i \in \mathcal{M}} \|\hat{x}_i - x_i\|_2^2
    |\mathcal{V}| = (1 - \rho)\,N
    C_{\mathrm{attn}}(\mathcal{V}) / C_{\mathrm{attn}}(N) = (1 - \rho)^2

    Where:

    • \mathcal{L}_{\mathrm{MLM}} is the cross-entropy over masked token positions and \mathcal{L}_{\mathrm{MAE}} the per-patch MSE; both are averaged over masked positions only.
    • x_i is the true content at position i, \hat{x}_i the prediction, and \tilde{x} the corrupted sequence containing \texttt{[MASK]} symbols.
    • \mathcal{M} and \mathcal{V} are the masked and visible index sets, disjoint with |\mathcal{M}| + |\mathcal{V}| = N for N total tokens or patches.
    • E is the deep encoder applied to visible tokens alone, D the shallow decoder, and m the shared learned mask-token embedding plus positional encoding.
    • \rho is the masking ratio: \rho = 0.15 for BERT and \rho = 0.75 for MAE, giving |\mathcal{V}| = 49 of N = 196 patches.
    • C_{\mathrm{attn}} is quadratic self-attention cost, so at \rho = 0.75 encoder attention drops to 1/16 and the token-wise MLP cost to 1/4; targets are usually per-patch normalized pixels rather than raw values.
    Line chart of ImageNet top-1 accuracy against masking ratio from 10 to 90 percent, showing a nearly flat fine-tuning curve near 85 percent and a strongly peaked linear-probing curve rising to about 73.5 percent at a 75 percent masking ratio then falling sharply at 90 percent

    Figure 2: Approximate ViT-L behaviour versus masking ratio: fine-tuning is nearly flat from 40% to 80%, while linear probing peaks sharply near 75%, which is why a ratio that looks extreme for text is the vision default.

    PropertyMAE (pixel targets)MLM (BERT-style)Contrastive / joint embedding
    Corruption level75% of patches removed15% of tokens replaced or keptNo masking; two augmented views
    Encoder inputVisible tokens only, no mask tokenFull sequence including [MASK]Full clean views
    Prediction head8-block 512-dim decoder, discardedSingle linear layer over the vocabularyMLP projector plus temperature
    Best transfer modeFull fine-tuning and dense tasksFine-tuning on token-level tasksFrozen features, k-NN, zero-shot retrieval
    Main weaknessCapacity spent on high-frequency detail; weak linear probeOnly ~15% of positions produce gradient per stepAugmentation-sensitive; risk of collapse

    Login to view more content