Tag: Transformer

  • DL0098 CLIP Zero-Shot Classification

    What is CLIP, and how does contrastive image-text training enable zero-shot classification?

    Answer

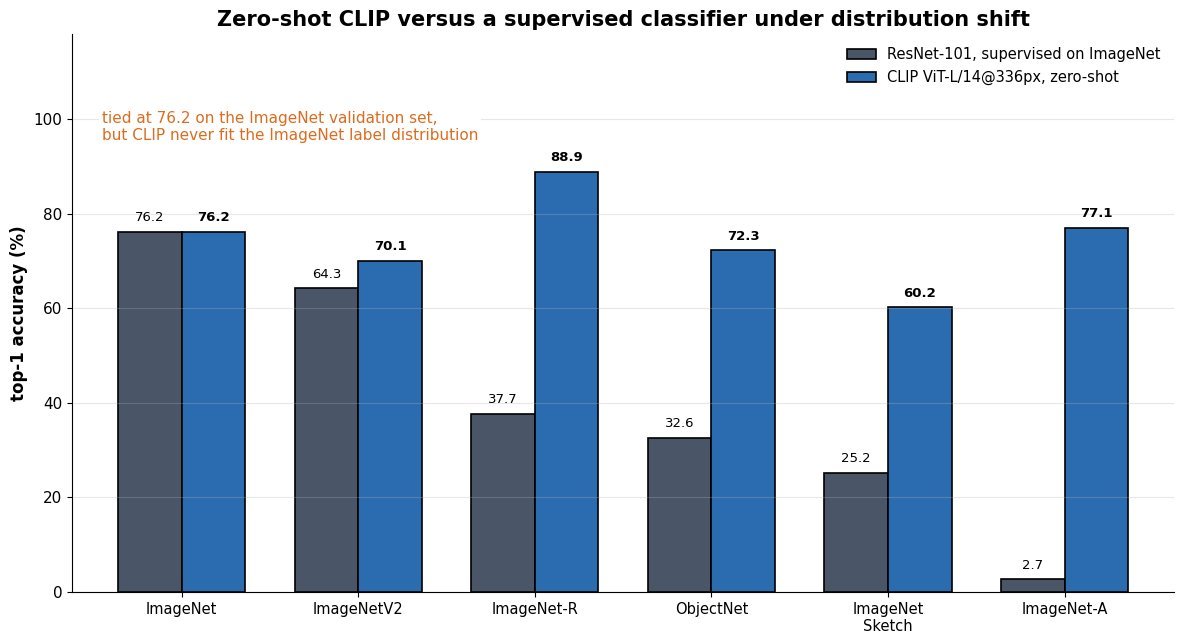
    CLIP (Contrastive Language-Image Pre-training) is a dual-encoder model: an image encoder (a ViT or ResNet) and a text encoder (a Transformer) each map their input to a vector in one shared embedding space, and the vectors are L2-normalized so their inner product is a cosine similarity. Training uses a batch of N image-caption pairs scraped from the web (400M pairs for the original model), computes the full N \times N similarity matrix, and applies a symmetric InfoNCE loss that pushes the N diagonal entries up and the N^2 - N off-diagonal entries down. Nothing in that objective mentions class labels, so the learned text encoder is a general classifier generator: at test time you write each candidate class as a sentence such as “a photo of a golden retriever”, encode it, and the resulting unit vectors act as the rows of a linear classifier weight matrix. Classification is then one matrix multiply followed by an argmax over cosine similarities, which is why a new label set costs a text-encoder forward pass rather than a training run. The best original model (ViT-L/14@336px) reaches 76.2% zero-shot top-1 on ImageNet, matching a supervised ResNet-101 with an identical 76.2% ImageNet top-1 that saw 1.28M labeled images, and it is far more robust under distribution shift.

    (1) Two Encoders, One Space: each modality has its own encoder plus a linear projection into a shared d-dimensional space; there is no cross-attention between them, so image and text embeddings can be computed and cached independently.
    (2) Symmetric InfoNCE Over The Batch: the loss is cross-entropy applied twice, once along rows (image picks its caption) and once along columns (caption picks its image), averaged.
    (3) Learned Temperature: the logit scale \exp(\tau) is a trained scalar initialized to a temperature of 0.07 and clipped at 100, which controls how hard the softmax pushes against near-miss negatives.
    (4) Prompts Become Classifier Weights: zero-shot inference replaces the learned classification head with text embeddings of class descriptions, so the label set is defined at inference time, not at training time.
    (5) Batch Size Is Part Of The Objective: negatives come only from the current batch, so the original model trained at N = 32768 across many GPUs with the similarity matrix sharded.
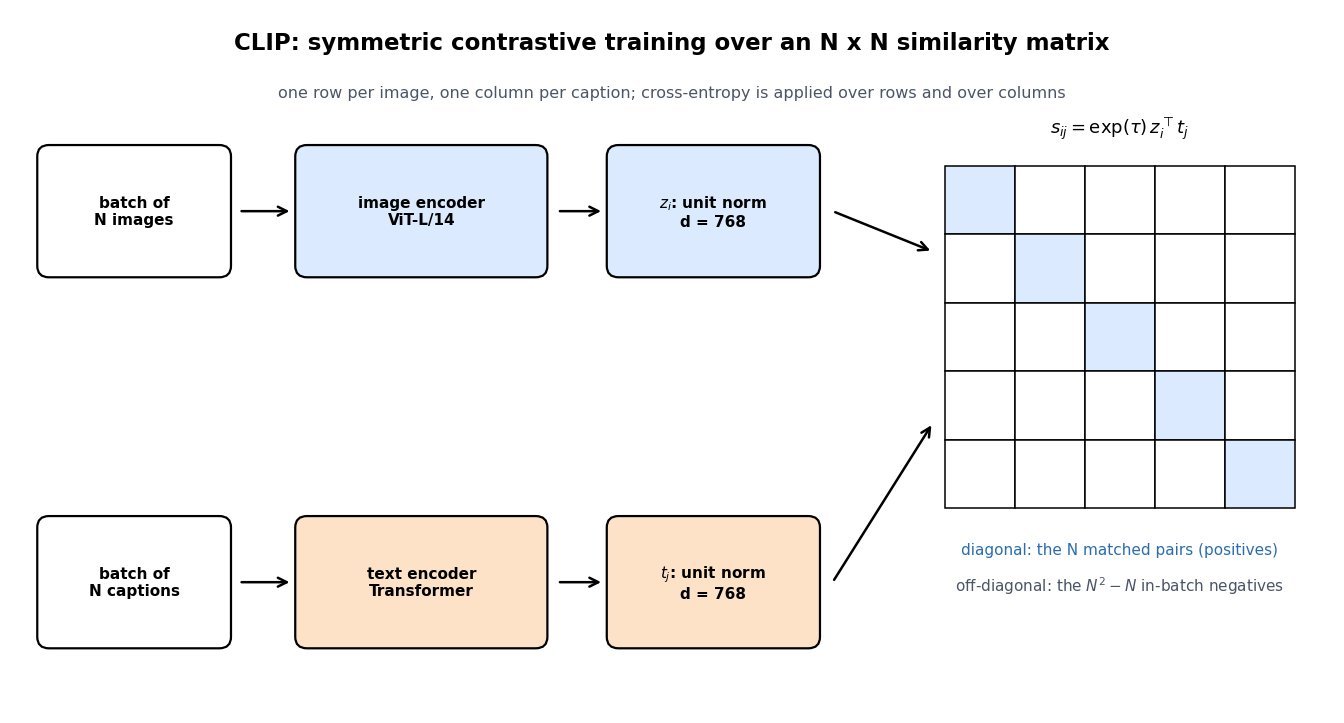
    Diagram of CLIP training: a batch of N images passes through an image encoder to unit-norm vectors, a batch of N captions passes through a text encoder to unit-norm vectors, and both feed an N by N cosine similarity matrix whose diagonal cells are the positive pairs

    Figure 1: Each training step builds the full N \times N similarity matrix; the N diagonal entries are the true pairs and every other entry is an in-batch negative, which is why one step at N = 32768 supplies over a billion contrastive comparisons.

    Three details separate a working CLIP from a broken one. Normalization is load-bearing: without it the model can shrink the loss by inflating embedding norms instead of improving alignment, and the learned temperature then has no fixed scale to calibrate against. Prompt wording matters more than people expect, because captions in the training data are sentences, not bare nouns: using “a photo of a {label}” instead of the raw class name adds about 1.3 points on ImageNet, and ensembling 80 prompt templates by averaging their normalized text embeddings adds roughly 3.5 points for almost no inference cost, since the averaged vectors are computed once and cached. Finally, label naming is part of the model: polysemous class names such as “boxer” (dog breed or athlete) or “crane” (bird or machine) must be disambiguated in the prompt, which is a form of engineering that has no analogue in a supervised classifier with integer labels.

    Mathematical Formulation:
    z_i = f_{\theta}(I_i) / \|f_{\theta}(I_i)\|_2
    t_j = g_{\phi}(T_j) / \|g_{\phi}(T_j)\|_2
    s_{ij} = \exp(\tau)\, z_i^{\top} t_j
    \mathcal{L}_{I} = -\frac{1}{N}\sum_{i} \log \frac{e^{s_{ii}}}{\sum_{j} e^{s_{ij}}}
    \mathcal{L} = \frac{1}{2}\left(\mathcal{L}_{I} + \mathcal{L}_{T}\right)
    \hat{y} = \arg\max_{c} \; z^{\top} t_c

    Where:

    • z_i and t_j are the unit-norm embeddings of image I_i and caption T_j, both in \mathbb{R}^{d} with d = 768 for ViT-L/14.
    • f_{\theta} is the image encoder plus its projection and g_{\phi} the text encoder plus its projection; the two share no weights.
    • s_{ij} is the scaled cosine similarity and \exp(\tau) the learned logit scale; since z_i^{\top} t_j lies in [-1, 1], the scale alone sets the sharpness of the softmax.
    • i, j \in \{1, \ldots, N\} index the batch; \mathcal{L}_{I} normalizes each row and \mathcal{L}_{T} the same expression with the softmax taken over columns.
    • \hat{y} is the zero-shot prediction for a query image with embedding z, and t_c is the (optionally prompt-ensembled and renormalized) text embedding of class c; the temperature drops out of the argmax.
    • Required initial condition: \tau = \log(1/0.07) at step 0, clamped so that \exp(\tau) \leq 100 throughout training to prevent the logits from exploding.
    Grouped bar chart comparing top-1 accuracy of a supervised ResNet-101 and zero-shot CLIP ViT-L/14 on ImageNet and five distribution-shift benchmarks, with CLIP far ahead on ImageNet-R, ObjectNet, Sketch and ImageNet-A

    Figure 2: Matched at 76.2% on the ImageNet validation set, the two models diverge sharply under shift: zero-shot CLIP keeps 77.1% on ImageNet-A and 60.2% on Sketch, where the supervised model drops to 2.7% and 25.2%, evidence that never fitting the ImageNet label distribution is itself a robustness mechanism.

    PropertyZero-shot CLIP (ViT-L/14@336px)Supervised classifier (ResNet-101)
    Task supervisionZero labeled examples for the task, 400M noisy web pairs for pretraining1.28M hand-labeled images for exactly this label set
    Adding a classEncode one more prompt and append the vector, no gradient stepCollect labels, then retrain or refit the head
    ImageNet top-176.2%76.2%
    ImageNet-A top-177.1%2.7%
    Specialized domainsWeak: near chance on tumor-patch classification, poor on counting and satellite land useStrong once in-domain labels exist
    Inference costOne image forward pass plus a d \times C matmul against cached text vectorsOne forward pass through a fixed head

    Login to view more content
  • DL0095 Zero-Shot vs Few-Shot

    How do zero-shot and few-shot prompting differ, and when does few-shot prompting beat fine-tuning?

    Answer

    Both are inference-time conditioning: the weights \theta never change, only the tokens placed before the query. Zero-shot prompting gives an instruction and the input, so the model must map the task description onto a behavior it already learned during pretraining or instruction tuning. Few-shot prompting (in-context learning) prepends K solved demonstrations (x_i, y_i) that pin down the output format, the label space, and the input distribution before the real query arrives, which is why it helps most on tasks with an unusual schema or a strict output contract. In the original GPT-3 study, TriviaQA accuracy for the 175B model moved 64.3% → 71.2% going from zero-shot to 64-shot, and the gap between the two settings shrinks as models get better instruction tuning. Few-shot prompting beats fine-tuning when labeled data is scarce (roughly tens of examples), the task spec is still changing weekly, one frozen base must serve many tasks, or no training infrastructure exists; fine-tuning wins once you have thousands of clean labels, need the lowest possible per-request cost and latency, or need behavior that no prompt reliably elicits. The decision is mostly economics plus label count, not model quality: demonstrations are paid for on every request, while a fine-tune is a one-time cost amortized over traffic.

    (1) Same Weights, Different Context: neither method computes a gradient; few-shot differs from zero-shot only by the demonstration block S_K inserted into the prompt.
    (2) Demonstrations Teach Format, Not Mostly Facts: the label space, input distribution, and output template drive most of the gain, which is why even partly incorrect labels in the exemplars often still work.
    (3) Cost Is Recurring: K exemplars add K T_{ex} prefill tokens per call, inflating time-to-first-token and input spend on every request forever.
    (4) Fine-Tuning Trades Setup For Marginal Cost: a LoRA run costs money once and then serves a short prompt, so it wins above a traffic break-even point.
    (5) Data Volume Decides The Ceiling: with a handful of labels in-context learning is usually ahead; with thousands, parameter updates reach accuracy no prompt matches.

    The mechanism is worth stating precisely because it predicts the failure modes. Demonstrations act as a task locator rather than a training set: replacing gold labels with random ones from the correct label set degrades few-shot accuracy far less than removing the labels entirely, which shows the exemplars are mostly specifying which distribution to condition on. That same conditioning creates strong biases: majority-label bias (a class over-represented in the exemplars gets over-predicted), recency bias (the last exemplar dominates), and ordering sensitivity that can swing accuracy by tens of points across permutations of the same K examples. Calibration on a content-free input and stratified, order-shuffled exemplar selection recover most of that variance, and any prompt tuned on a large validation set is no longer honestly “few-shot” because the selection itself consumed labels.

    Line chart of task accuracy against the number of in-context examples for an 8B and a 70B frozen model, with two dashed horizontal reference lines for an 8B model fine-tuned on 100 and on 5000 labels

    Figure 1: Illustrative shot-scaling behavior: most of the in-context gain arrives by K = 4 and flattens after K = 16, a model fine-tuned on only 100 labels sits near the few-shot curve, and 5,000 labels put the fine-tuned small model above the frozen large model.

    Mathematical Formulation:
    p_{\theta}(y \mid I, x)
    p_{\theta}(y \mid I, S_K, x)
    S_K = ((x_1, y_1), \ldots, (x_K, y_K))
    T_{ctx} = T_I + K T_{ex} + T_x
    40 + 32 \times 60 + 30 = 1990
    R^{*} = \frac{C_{ft}}{K T_{ex} c_{in}}

    Where:

    • y is the generated answer, x the query, and I the instruction text; the first two lines are the zero-shot and few-shot predictive distributions under identical \theta.
    • S_K is the demonstration block and K the shot count, with K = 0 recovering the zero-shot case exactly.
    • T_I, T_{ex}, and T_x are token lengths of the instruction, one exemplar, and the query; T_{ctx} is the prefill length that sets time-to-first-token.
    • The numeric line instantiates T_{ctx} for K = 32 exemplars of 60 tokens each, giving 1,990 prompt tokens against 70 for the zero-shot prompt.
    • c_{in} is the price per input token, C_{ft} the one-time fine-tuning cost, and R^{*} the break-even request volume above which the fine-tune is cheaper; it assumes both options serve the same output length and per-token price.

    Plugging in real numbers makes the trade-off concrete. At c_{in} = \$0.30 per million input tokens, the 1,920 extra tokens from 32 exemplars cost about \$0.00058 per request, so a \$60 LoRA job pays for itself after roughly 104,000 requests. Prompt caching changes that arithmetic sharply: because the exemplar block is a fixed prefix, cached reads billed near 10% of the input rate push the break-even beyond a million requests and also cut the prefill latency penalty. That is why the honest answer to “few-shot or fine-tune” depends on traffic volume, prefix stability, and whether your serving stack caches, not on which technique sounds more advanced.

    Line chart of cumulative extra cost in dollars against requests served, comparing few-shot prompting with and without prompt caching against a flat one-time fine-tuning cost, with the crossover marked near 104 thousand requests

    Figure 2: Illustrative cost crossover: the few-shot line grows linearly with traffic because the exemplar prefix is re-billed per call, the fine-tune is a flat one-time charge, and prompt caching flattens the few-shot slope by roughly an order of magnitude.

    PropertyZero-shotFew-shot (in-context)Fine-tuning (LoRA)
    Labeled examples neededNone, only a clear instructionTypically 4 to 64, plus a small set for prompt selectionHundreds to tens of thousands
    Where task knowledge livesPretraining and instruction tuning onlyIn the prompt, re-sent or cached per requestIn adapter weights, prompt stays short
    Prompt tokens per request70 in the worked example1,990 at K=32, so higher time-to-first-token70, same as zero-shot
    Iteration speedSeconds, edit the instructionSeconds, swap or reorder exemplarsHours per run plus eval and deploy
    Main failure modeWrong output schema, task misreadMajority-label and recency bias, ordering variance, context limitsOverfits small or noisy label sets, forgets off-task behavior
    Multi-task servingOne model, one endpointOne model, per-task prompt templateOne adapter per task over a frozen base

    Login to view more content
  • DL0094 Evaluating an LLM

    How do you evaluate an LLM?

    Answer

    There is no single number, so I treat evaluation as a stack of layers chosen to match how the model will actually be used: intrinsic likelihood (perplexity or bits per byte) at the bottom, static capability benchmarks above it, automated graders such as unit tests and LLM-as-judge, human pairwise preference, and finally an online A/B test on the real product metric. Each layer up the stack is closer to user value and more expensive, so cheap layers act as fast regression gates and expensive layers make ship decisions. The practical work is defining the task metric first, then building a private evaluation set drawn from production traffic, because public leaderboards measure a distribution that is rarely yours. Three things decide whether an evaluation is worth anything: contamination control, judge calibration against human labels, and error bars. Most reported “improvements” of one or two points on a 1000-item benchmark are inside the noise band and would not survive a paired significance test.

    (1) Start From The Deployment Task: a RAG assistant is scored on groundedness, citation precision, and refusal correctness, a coding model on pass@k against hidden tests, an agent on end-to-end task completion; a generic leaderboard score answers none of these.
    (2) Intrinsic Versus Extrinsic: perplexity is cheap and useful for pretraining and quantization regressions, but it is not comparable across tokenizers and correlates weakly with instruction-following quality.
    (3) Static Benchmarks Decay: MMLU-Pro, GPQA, MATH, HumanEval, and SWE-bench Verified are reproducible and cheap, but they saturate and they leak into pretraining corpora, so contamination checks (n-gram overlap, held-out variants, release-date filtering) are mandatory.
    (4) Automated Graders Scale, With Bias: the loop is sample responses → grade with a rubric or unit tests → aggregate with intervals; a judge model shows position, verbosity, and self-preference bias, so swap the answer order and calibrate agreement with humans before trusting it.
    (5) Human Preference Is The Open-Ended Gold Standard: pairwise votes fitted with a Bradley-Terry (Elo) model give a single latent quality score, at the cost of slow turnaround and annotator disagreement.
    (6) Report Uncertainty, Safety, And Cost: every score needs a confidence interval and a paired test against the baseline, plus a separate axis for jailbreak resistance, toxicity, PII leakage, and the p95 latency and cost per request that decide whether the win is affordable.

    Five stacked layers of LLM evaluation from intrinsic perplexity at the bottom through static benchmarks, automated graders, human preference, and production A/B testing at the top, with cost and fidelity increasing upward

    Figure 1: The evaluation stack. Cheap layers at the bottom run on every commit as regression gates; the expensive layers at the top are the only ones that measure user value, so a release decision needs evidence from both ends.

    Two failure modes dominate real evaluation work. The first is contamination: a model that has memorized a benchmark scores high without generalizing, which you detect by rewriting items into paraphrases or numeric variants and watching the score collapse, or by using benchmarks whose items post-date the training cutoff. The second is judge miscalibration: an LLM judge that prefers longer, more confidently worded answers will happily rank a verbose model above a correct one, so I always measure judge-human agreement (Cohen’s kappa above roughly 0.6 before the judge is allowed to gate a release) and control for response length. On top of that, generation is stochastic, so a benchmark run at temperature 0.7 has run-to-run variance of its own; fix seeds and decoding parameters, or report the mean over several runs. Finally, offline wins must be confirmed online, because the production metric that matters (resolution rate, edit distance to the accepted answer, escalation rate) frequently moves in the opposite direction from a benchmark score.

    PropertyStatic benchmarkLLM-as-judgeHuman preference
    What it measuresClosed-form correctness on a fixed item setRubric compliance and pairwise win rate on open-ended promptsLatent quality as perceived by real users or experts
    Turnaround per modelMinutes to hours, fully automatedHours, bounded by judge API throughput and costDays to weeks, bounded by annotator supply
    Main failure modeContamination and saturation; near-zero headroom on old suitesPosition, verbosity, and self-preference biasAnnotator disagreement and prompt-mix drift
    ReproducibleYes, if decoding and prompt template are pinnedOnly against a pinned judge version; judge upgrades shift scoresNo, each round is a fresh sample of raters
    Best used forCI regression gates and capability screeningScaling open-ended comparison between candidate checkpointsFinal ranking and calibrating the automated judge

    Mathematical Formulation:
    \mathrm{PPL} = \exp\left(-\frac{1}{T}\sum_{t=1}^{T}\log p(x_t \mid x_{1:t-1})\right)
    \mathrm{pass@}k = 1 - \frac{\binom{n-c}{k}}{\binom{n}{k}}
    P(a \succ b) = \frac{1}{1 + 10^{(R_b - R_a)/400}}
    \mathrm{SE} = \sqrt{\frac{\hat{p}(1-\hat{p})}{N}}

    Where:

    • \mathrm{PPL} is perplexity over a held-out sequence x_1,\ldots,x_T, with t indexing tokens; it depends on the tokenizer, so bits per byte is the cross-model comparable form.
    • n is the number of samples drawn per coding problem, c the number that pass the hidden tests, and k the budget of attempts scored; this is the unbiased pass@k estimator, averaged over problems.
    • P(a \succ b) is the modelled probability that response a beats b, and R_a, R_b are the fitted Bradley-Terry ratings on the Elo scale, where a 100-point gap implies about a 64% win rate.
    • \hat{p} is the observed accuracy on N independent items and \mathrm{SE} its standard error; the 95% interval is \hat{p} \pm 1.96\,\mathrm{SE}, which for \hat{p}=0.7 and N=1000 is roughly \pm 2.8 points.
    • Required condition: items must be independent and not contaminated; when two models are scored on the same items, use a paired test (McNemar or a paired bootstrap) rather than comparing two independent intervals.
    Bar chart of three model accuracies of 71.2, 73.5 and 78.9 percent on a 1000-item benchmark with 95 percent confidence interval error bars of about 2.8 points, showing the first two intervals overlapping

    Figure 2: Accuracy with 95% intervals on a 1000-item benchmark. The 2.3-point gap between the first two models sits well inside the noise band, so an unpaired claim of improvement is unsupported; only the third model separates cleanly.


    Login to view more content
  • DL0093 Distillation vs Serving

    When is distilling a large model into a small one a better strategy than serving the large model directly, for example behind a high-traffic assistant API?

    Answer

    Distillation wins when the recurring cost of inference, multiplied by sustained traffic, dominates the one-time cost of teacher labeling plus student training, and when the task distribution is narrow enough that the teacher’s surplus capability is never exercised. The decision is a break-even calculation: if the teacher costs $2.00 per 1k requests and an 8B student costs $0.25, and distillation costs $1,400 once (500k teacher-labeled prompts at $1,000 plus 200 GPU-hours at $400), the crossover is 800k requests, roughly 18 hours at 12 QPS. Two other conditions make distillation the only option rather than the cheapest one: a hard latency SLO that no batching strategy can meet with a 70B decoder, and a fixed memory envelope such as a phone NPU or a single 24 GB GPU, where quantization alone cannot close a 10x parameter gap. Serve the large model directly when traffic is low, when the input distribution is open-ended, or when the win is available more cheaply through quantization, speculative decoding, prompt caching, or a small-to-large cascade, since those preserve behavior and skip a new eval and re-qualification cycle. Distillation also carries a maintenance tax: every teacher upgrade reopens the labeling job, and the student inherits the teacher’s errors without the capacity to recover from them.

    (1) Break-Even Volume: divide the one-time distillation cost by the per-request savings; below that volume, serving the teacher is strictly cheaper, and the payback period, not the compression ratio, is the number that decides the project.
    (2) Latency Floor, Not Throughput: autoregressive decoding is memory-bandwidth bound and sequential, so per-token latency scales with parameter count and cannot be batched away; shrinking the model is one of the few levers that moves p99 rather than QPS per GPU.
    (3) Task Breadth Decides Feasibility: on a stable, narrow task a student 8x smaller typically recovers 98-99% of teacher quality, while an open-ended assistant distribution loses many points because the teacher’s broad competence is exactly what is being compressed away.
    (4) Hard Deployment Constraints: on-device, air-gapped, or offline targets impose a memory and power budget that no serving trick satisfies, so distillation becomes a requirement rather than an optimization.
    (5) Cheaper Alternatives First: speculative decoding is distribution-preserving and needs no re-qualification, quantization is a one-line config change, and a router that sends easy traffic to a small model keeps the teacher available for the tail; distillation is the only lever that actually reduces the footprint, and it is the most expensive to maintain.

    Mathematical Formulation:
    Q^{*} = \frac{C_{0}}{c_{L} - c_{S}}
    C_{0} = N c_{L} + C_{\text{train}}
    \mathcal{L} = (1-\lambda)\mathcal{L}_{\text{CE}} + \lambda \tau^{2} \mathcal{L}_{\text{KD}}
    \mathcal{L}_{\text{KD}} = \mathrm{KL}(p^{T}_{\tau} \| p^{S}_{\tau})

    Where:

    • Q^{*} is the break-even request volume, the point at which cumulative distilled-serving cost equals cumulative teacher-serving cost.
    • c_{L} and c_{S} are the marginal serving costs per request for the large teacher and the small student; the difference c_{L} - c_{S} must be positive for distillation to ever pay back.
    • C_{0} is the one-time cost, composed of teacher inference over N unlabeled prompts plus student training C_{\text{train}}; engineering and eval time belong here too and usually exceed the compute.
    • \mathcal{L} is the student objective, mixing hard-label cross-entropy \mathcal{L}_{\text{CE}} with the distillation term \mathcal{L}_{\text{KD}} under mixing weight \lambda \in [0,1].
    • \tau is the softmax temperature applied to both teacher and student logits, and the \tau^{2} factor rescales the gradient so \lambda stays meaningful as \tau changes; p^{T}_{\tau} and p^{S}_{\tau} are the tempered teacher and student distributions.
    • Required condition for the whole strategy: the student must also satisfy the latency and memory constraints, t_{S} \leq \text{SLO} and m_{S} \leq m_{\max}, which no amount of traffic volume can buy.
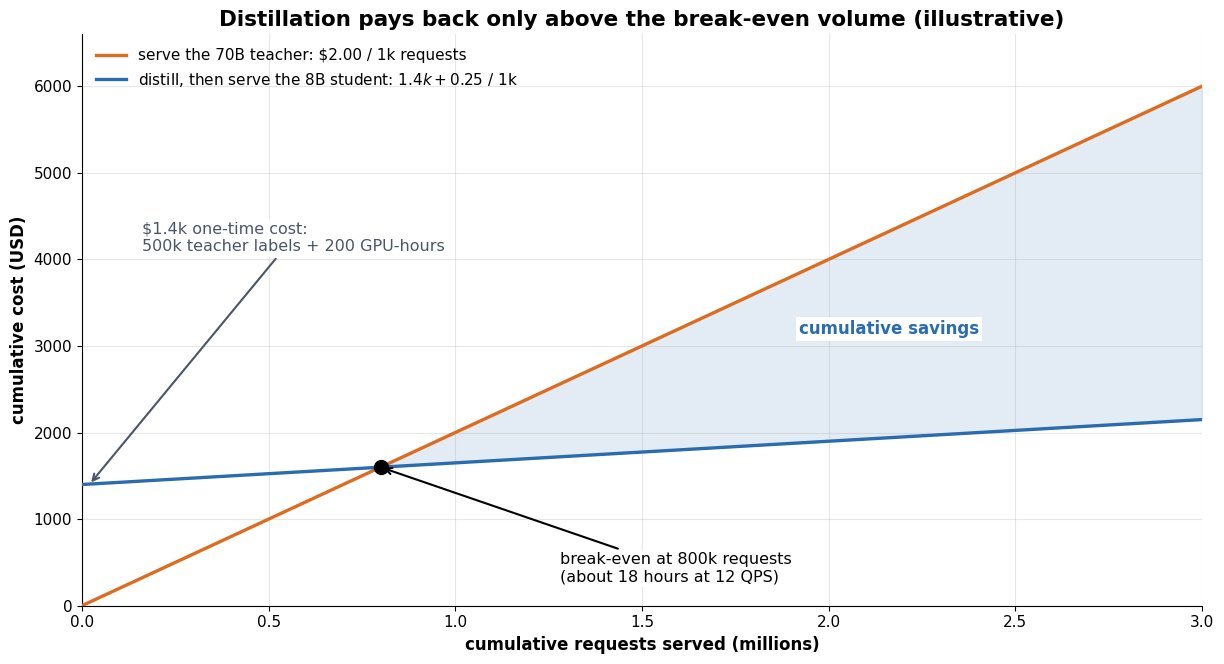
    Line chart of cumulative serving cost in dollars against cumulative requests in millions: serving the 70B teacher rises linearly at 2 dollars per thousand requests from the origin, while the distillation path starts at 1400 dollars and rises at 0.25 dollars per thousand, crossing at 800 thousand requests with the savings region shaded beyond the crossing

    Figure 1: Illustrative cost curves: the distilled path carries a $1.4k fixed intercept but an eight-times shallower slope, so the break-even sits at 800k requests and every request after that is pure savings.

    The break-even math is only valid if the student actually holds quality on the traffic you will receive, and that depends far more on task breadth than on the compression ratio. A single-intent classifier, a fixed extraction schema, or one product domain compresses well because the teacher’s decision boundary in that slice is simple and you can generate unlimited soft targets for it; an open-ended assistant does not, because the surplus capacity is the product. When breadth is the problem, a cascade is usually the better answer than a bigger student: route every request to the distilled model, escalate the tail flagged by a confidence or verifier signal to the teacher, and you capture most of the cost win while keeping the quality ceiling. Whatever you choose, budget for the maintenance tax, since a teacher upgrade invalidates the student, drifting inputs silently move outside the distilled distribution, and you now own two eval suites instead of one.

    Semi-log chart of percentage of teacher quality retained against student parameter count from 0.5B to 70B, showing a narrow single-domain task staying above the 98 percent floor from about 1B upward while an open-ended assistant task falls to roughly 71 percent at 1B and only reaches the floor near 20B

    Figure 2: Illustrative quality retention: on a narrow task a 1B student already clears a 98% floor, while the same student on open-ended traffic gives up roughly 27 points, which is why breadth, not the compression factor, gates the decision.

    PropertyDistill to a small studentServe large + quantizationServe large + speculative decoding
    Memory footprint8-20x smaller, can drop from 8 GPUs to 1 or to a phone2-4x smaller weights, KV cache mostly unchangedSlightly larger, the drafter is an extra resident model
    Quality guaranteeNone, must be re-measured per task; tail regressions are commonSmall measurable drift, worse at 4-bit and on long contextDistribution-preserving, output matches the teacher exactly
    Typical latency gain4-6x on per-token latency, the largest available lever1.5-2.5x, bounded by bandwidth saved on weights2-3x at low batch, degrades as batch size grows
    One-time costLabel generation, training runs, a new eval harnessCalibration pass plus a quality spot-checkServing-stack work, no retraining of the target model
    Cost when the teacher is upgradedFull re-distillation and re-qualificationRe-run calibration onlySwap the target, optionally refresh the drafter
    Wins whenHigh sustained traffic, narrow task, or a fixed device budgetYou need a fast, low-risk cost cut on broad trafficLatency matters, batches are small, and quality cannot move

    Login to view more content
  • DL0092 Reward Hacking in RLHF

    What is reward hacking, and how does it manifest in RLHF?

    Answer

    Reward hacking is what happens when a policy maximizes the measured reward instead of the intended objective, exploiting the gap between the two. In RLHF that gap is concrete and unavoidable: the reward model r_{\phi} is a finite-capacity network fit to a fixed set of human preference pairs, so it equals the true human utility r^{*} plus an error term \epsilon. PPO does not distinguish the two, and since it actively searches for the highest-scoring completions, it lands precisely in the regions where \epsilon is largest, which are the regions the reward model never saw during training. The empirical signature is the overoptimization curve: proxy reward climbs monotonically while gold reward measured by fresh human raters rises, peaks, and then falls. The visible symptoms are familiar to anyone who has run RLHF: verbosity, heavy markdown formatting, confident-sounding hedges, and sycophancy, all of which are cheap ways to increase r_{\phi} without increasing helpfulness.

    (1) Goodhart Under Active Search: the reward model is only a proxy, and RL is an adversary that optimizes against its error surface rather than sampling from it.
    (2) Distribution Shift Is The Mechanism: preference labels are collected on SFT-model samples, so as the policy moves, its outputs leave the reward model’s training support and the error term stops being small.
    (3) Length Is The Canonical Exploit: human raters mildly prefer longer answers, the reward model amplifies that correlation, and a large share of RLHF win-rate gains disappears once responses are length-controlled.
    (4) The KL Term Is A Leash, Not A Fix: the \beta-weighted KL penalty bounds how far the policy can travel from the reference model, which delays hacking but trades away real gains at the same time.
    (5) Detection Requires An Off-Proxy Signal: you cannot see hacking in the training curve, because the training curve is the thing being hacked; it takes fresh human labels, a held-out reward model, or a verifiable check to notice.

    Diagram of the RLHF loop: fixed preference pairs train a proxy reward model, the reward model scores policy samples, PPO or GRPO updates the policy under a KL penalty, and fresh samples feed back into the reward model while drifting off its training support

    Figure 1: The RLHF loop (preferences → reward model → policy update → fresh samples) closes on a fixed, off-policy reward model, so every optimization step pushes the sampled distribution further from where the proxy was ever validated.

    It helps to separate the failure modes by where the exploit lives. Spurious-feature hacking targets shallow correlates of quality that the reward model learned from labeler habits: length, bullet lists, bold headers, apologetic openers, restating the question. Sycophancy targets the labelers themselves, since annotators reward answers that agree with them, so the policy learns to mirror the stated opinion rather than correct it. Off-distribution spikes are the strangest class: degenerate strings and odd punctuation patterns that no human ever rated, which the reward model happens to score near its maximum. In agentic and code settings the same pressure produces test gaming, where the model special-cases unit tests or edits the test file instead of fixing the function.

    Mathematical Formulation:
    J(\pi_{\theta}) = \mathbb{E}[r_{\phi}(x,y)] - \beta\,\mathcal{D}
    \mathcal{D} = D_{\mathrm{KL}}(\pi_{\theta} \| \pi_{\mathrm{ref}})
    r_{\phi}(x,y) = r^{*}(x,y) + \epsilon(x,y)
    d = \sqrt{\mathcal{D}}
    R_{\mathrm{gold}}(d) = d\,(\alpha - \beta_{o}\log d)

    Where:

    • J(\pi_{\theta}) is the RLHF objective actually optimized, and R_{\mathrm{gold}} is the true human-judged quality, which is never in the gradient.
    • x is the prompt, y \sim \pi_{\theta}(\cdot\mid x) the sampled completion, and \pi_{\mathrm{ref}} the frozen SFT reference policy.
    • r_{\phi} is the learned proxy reward, r^{*} the intended reward, and \epsilon the model error whose magnitude grows off the preference-data support.
    • \beta is the KL coefficient (typical range 0.01 to 0.1), so \beta \to 0 removes the leash and \beta large pins the policy to the reference.
    • d is the square-root KL distance used as the x-axis of overoptimization scaling laws; \alpha and \beta_{o} are fitted constants, distinct from the KL coefficient \beta.
    • Required initial condition: \pi_{\theta} = \pi_{\mathrm{ref}} at step 0, so d = 0 and R_{\mathrm{gold}} starts at the SFT baseline; the peak of the fitted curve sits at \log d = (\alpha - \beta_{o})/\beta_{o}.
    Line chart with square-root KL distance on the x axis showing proxy reward rising monotonically while gold reward rises to a peak near d equals 3.1 and then declines below zero, with the peak marked as the early stopping point

    Figure 2: Illustrative overoptimization: the proxy score the trainer logs never stops improving, while gold reward turns over around d \approx 3.1 and eventually falls below the SFT baseline.

    MitigationMechanismWhat it buysCost or limitation
    KL penalty and early stoppingBounds the distance travelled from the reference policyKeeps the policy inside the region where the proxy was validatedCaps genuine gains too; the right KL budget is only knowable from gold evals
    Reward model ensemblesScore with several models, optimize a pessimistic aggregate such as the minimumSuppresses idiosyncratic per-model error spikesMembers share preference data, so correlated biases like length survive; N times the scoring cost
    Iterative on-policy relabelingCollect fresh preferences on current-policy samples and refit the reward modelDirectly closes the distribution shift that creates the error termSlow and expensive; each round needs new human annotation
    Explicit bias disentanglingFactor the reward into a quality head and a length or format head, then discard the latterRemoves the single largest known spurious correlateOnly fixes biases you already named; new exploits appear elsewhere
    Verifiable or rule-based rewardReplace the learned model with a checker: unit tests, a symbolic solver, format rulesNo learned error surface to climb on checkable tasksOnly applies where ground truth exists; test gaming and reward tampering remain

    Login to view more content
  • DL0091 Quantization Formats

    What is quantization (FP16/BF16/INT8/INT4), and how does it affect model memory and accuracy?

    Answer

    Quantization stores weights, activations, or KV-cache entries in a numeric format with fewer bits than the FP32 values the model was defined in, trading numerical resolution for memory and bandwidth. Memory falls almost exactly linearly in bit width: a 70B-parameter model occupies 280 GB in FP32, 140 GB in FP16 or BF16, 70 GB in INT8, and roughly 37 GB in 4-bit with group scales. The two 16-bit floating formats differ only in how they split the 16 bits: FP16 spends 5 bits on the exponent and 10 on the mantissa (max magnitude 65,504, so gradients can overflow without loss scaling), while BF16 keeps FP32’s 8 exponent bits and truncates the mantissa to 7, giving the full 10^{38} dynamic range at coarser resolution. Below 16 bits the formats become integers plus a scale, so a real number is recovered as \hat{w} = s(w_q - z), and quality now depends on how finely those scales are estimated. In practice INT8 weights are essentially free in accuracy with per-channel scales, INT4 weight-only costs a few tenths of a perplexity point on a 70B model with a good calibration method, and quantizing activations is the hard part because transformer activations contain a handful of channels with magnitudes 20x to 100x the median.

    (1) Exponent Versus Mantissa: FP16 and BF16 use the same 16 bits, but BF16’s 8 exponent bits buy dynamic range at the cost of precision, which is why BF16 is the default training format on modern accelerators and needs no loss scaling.
    (2) Memory Is Linear In Bits: parameter memory is N b / 8 bytes, so each halving of the bit width halves the checkpoint, the resident weights, and the bytes moved per token.
    (3) Integers Need A Scale And A Granularity: per-tensor scaling is cheapest, per-channel is the practical minimum for weights, and group-wise (typically 128 weights per scale) is what makes 4 bits usable.
    (4) Weight-Only Helps Because Decode Is Bandwidth-Bound: single-stream generation reads every weight per token, so 4-bit weights cut latency even when the matmul itself runs in FP16 after dequantization.
    (5) Error Concentrates In Outliers: a single extreme value stretches the scale and destroys resolution for every other value in the group, which is why outlier handling matters more than the nominal bit count.

    Bit-field diagram comparing FP32, FP16, BF16, FP8 E4M3, INT8 and INT4: each format is drawn as a proportional bar split into sign, exponent and mantissa fields, with dynamic-range notes on the right

    Figure 1: Bit budgets drawn to scale. BF16 keeps FP32’s 8 exponent bits and pays with 7 mantissa bits, FP16 does the reverse, and the sub-8-bit formats drop the exponent entirely in favour of an external scale factor.

    An integer format is defined by an affine map from the real line onto 2^b evenly spaced levels. Symmetric quantization fixes the zero-point at z = 0 and is the standard choice for weights, whose distribution is roughly zero-centred; asymmetric quantization keeps a learned z and suits post-ReLU or post-GELU activations that sit mostly on one side of zero. The granularity of s is the real design knob: one scale per tensor stores nothing extra but is destroyed by a single outlier channel, whereas one scale per group of g = 128 weights adds a 16-bit scale and a 16-bit zero-point per group, which raises an INT4 tensor from 4.0 to 4.25 effective bits. Calibration methods such as GPTQ and AWQ then choose the rounding of each weight to minimise the error of the layer output on a small calibration set rather than the error of the weight itself, which is what closes most of the remaining gap at 4 bits.

    Mathematical Formulation:
    \hat{w} = s (w_q - z)
    w_q = \mathrm{clip}(\mathrm{round}(w/s) + z,\ 0,\ 2^b - 1)
    s = \frac{\max(w) - \min(w)}{2^b - 1}
    b_{eff} = b + \frac{32}{g}
    M = \frac{N \, b_{eff}}{8}

    Where:

    • \hat{w} is the dequantized value actually used in the matmul, and w is the original FP32 or BF16 weight.
    • w_q is the stored integer code, clipped into \{0,\ldots,2^b-1\}; values outside the calibrated range are saturated rather than wrapped.
    • s is the scale (step size) and z the zero-point; symmetric quantization sets z = 0 and uses s = \max|w| / (2^{b-1} - 1).
    • b is the nominal bit width and g the group size, the number of weights sharing one (s, z) pair stored in FP16, hence the 32/g overhead.
    • b_{eff} is the effective bits per weight; with b = 4 and g = 128 this gives b_{eff} = 4.25.
    • N is the parameter count and M the weight memory in bytes; for N = 7 \times 10^{10} this is about 37 GB. Required condition: s > 0 must be computed from calibration data before any activation quantization is applied.
    Bar chart of weight memory in gigabytes for a 70 billion parameter model: 280 GB in FP32, 140 GB in FP16 or BF16, 70 GB in INT8 and 37 GB in INT4 with group size 128, with a dashed line marking the 80 GB capacity of one GPU

    Figure 2: Weight memory for a 70B model. Only the 4-bit variant fits one 80 GB GPU with room left for the KV cache, and because decoding is memory-bandwidth bound the same reduction shows up directly in tokens per second.

    PropertyFP16BF16INT8INT4 (g=128)
    Layout1 sign, 5 exponent, 10 mantissa1 sign, 8 exponent, 7 mantissa8-bit integer plus a per-channel FP16 scale4-bit integer plus a scale per 128 weights
    Dynamic rangeMax 65,504; underflows below 6e-5Same as FP32, about 3.4e38256 levels inside the calibrated range16 levels per group; clipping is the main risk
    70B weights140 GB140 GB70 GBAbout 37 GB at 4.25 effective bits
    Typical roleInference, and training with loss scalingDefault training and master-weight formatW8A8 serving at high batch, compute-bound prefillWeight-only decode on capacity-limited GPUs
    Accuracy costNone measurable for inferenceNone measurable; the lost mantissa bits rarely matterUnder 1% with per-channel scales and outlier handlingA few tenths of perplexity on 70B, clearly worse below 7B
    Hardware supportTensor cores on every recent GPUAmpere onward, plus TPUsRoughly 2x the FP16 matmul throughputNo native 4-bit matmul on most GPUs; kernels dequantize in registers

    Login to view more content
  • DL0090 Post-Training vs Quantization-Aware Training

    What is the difference between post-training quantization and quantization-aware training, and how would you choose between them when shipping a model to an on-device NPU?

    Answer

    Post-training quantization (PTQ) takes a finished float checkpoint and converts it to low precision after the fact: a few hundred unlabeled samples are pushed through the network so the tool can observe activation ranges, pick a scale and zero point per tensor or per channel, and round the weights. No labels, no loss, no backward pass, and typically minutes to a couple of hours on a single GPU. Quantization-aware training (QAT) instead inserts fake-quantization nodes into the graph and continues training, so every forward pass sees rounded values while gradients flow through the non-differentiable rounding step via the straight-through estimator (STE). The one-line distinction worth memorizing: PTQ fits the quantizer to fixed weights, while QAT moves the weights to fit the quantizer. At INT8 on a well-behaved network the two land within a few tenths of a point of each other, so PTQ wins on cost; at 4 bits and below, or on outlier-heavy and depthwise-separable models, PTQ falls off a cliff and QAT recovers most of the loss.

    (1) Where It Happens: PTQ is a post-processing step on a frozen checkpoint; QAT is a fine-tuning stage that must run inside your training pipeline with the original data loader and loss.
    (2) What Data It Needs: PTQ needs only a small calibration set (roughly 128 to 1024 unlabeled samples) that is representative of deployment traffic; QAT needs labeled data, or at least a teacher model for distillation.
    (3) The STE Trick: rounding has zero gradient almost everywhere, so QAT pretends the quantizer is the identity inside the clipping range and passes the gradient straight through, which is what lets weights drift toward values that round well.
    (4) Where PTQ Breaks: per-tensor scales collapse when channel ranges differ by orders of magnitude (depthwise convolutions), when activations carry massive outliers (transformer residual streams), or when the bit width drops to 4 or fewer.
    (5) Decision Rule: always try PTQ first because it is cheap and reversible; escalate to QAT only when a measured accuracy gap survives per-channel scales, better range selection, and bias correction.

    Mechanically, a fake-quant node applies quantize → dequantize in the forward pass, so tensors stay in float during QAT but carry exactly the values the integer kernel will produce at inference. That means QAT does not speed up training; it slows it down by 20 to 40 percent while simulating the deployment numerics. The payoff is that the optimizer sees the rounding error as part of the loss surface and settles into flatter minima where a few least significant bits do not matter. PTQ has no such feedback: whatever error the rounding introduces is simply propagated forward, which is why its failure mode is a sudden collapse rather than a graceful slide.

    Two horizontal pipelines. Top row, post-training quantization: trained FP32 checkpoint, calibration pass on 128 to 1024 unlabeled samples, fit scale and zero point, export INT model. Bottom row, quantization-aware training: trained FP32 checkpoint, insert fake-quant nodes, fine-tune with labels and STE gradients, fold scales and export INT model.

    Figure 1: The same checkpoint, two routes to integer inference. PTQ adds one forward-only calibration pass; QAT adds a full fine-tuning loop whose gradients reach the weights through the straight-through estimator.

    Mathematical Formulation:
    s = \frac{x_{max} - x_{min}}{2^{b} - 1}
    q = \mathrm{clip}(\lfloor x/s \rceil + z, 0, 2^{b} - 1)
    \hat{x} = s\,(q - z)
    \frac{\partial \mathcal{L}}{\partial x} \approx \frac{\partial \mathcal{L}}{\partial \hat{x}} \cdot \mathbf{1}[x_{min} \leq x \leq x_{max}]

    Where:

    • \hat{x} is the dequantized value the network actually computes with, and x is the original float weight or activation.
    • s is the scale and z the zero point (the integer that maps to exactly 0.0); q is the stored integer code.
    • b is the bit width, so b = 8 gives 256 levels and b = 4 only 16; x_{min}, x_{max} are the calibrated clipping bounds, chosen per channel for weights and per tensor or per token for activations.
    • \lfloor \cdot \rceil is round-to-nearest and \mathrm{clip} saturates values outside the representable range; both are the source of the error being managed.
    • The last line is the straight-through estimator: the indicator \mathbf{1}[\cdot] passes the gradient unchanged inside the clipping range and zeroes it outside, which is the only reason QAT can backpropagate through rounding.
    • PTQ solves for s, z with x held fixed; QAT keeps the whole chain in the graph and updates x (and, with learned-step methods, s itself).
    Line chart of top-1 accuracy versus bit width from INT8 down to INT2. PTQ tracks the FP32 baseline at INT8 and INT6 but drops to 68 at INT4, 41 at INT3 and 6 at INT2, while QAT stays at 74.5 at INT4, 71 at INT3 and 62 at INT2.

    Figure 2: Illustrative accuracy versus bit width. The two methods are indistinguishable at INT8, which is why PTQ dominates production INT8 pipelines; the gap opens abruptly at 4 bits and below, where the rounding error stops behaving like small additive noise.

    DimensionPost-Training QuantizationQuantization-Aware Training
    Data needed128 to 1024 unlabeled calibration samplesLabeled training data or a teacher for distillation
    ComputeMinutes to hours, one GPU, forward passes onlyHours to days, often multi-GPU, full training loop
    Pipeline accessWorks on a vendor or third-party checkpointRequires the original recipe, loss and hyperparameters
    Typical INT8 resultWithin roughly 0.5 points of FP32 with per-channel weightsEssentially lossless, rarely worth the cost
    Typical INT4 resultLarge drop unless advanced methods (GPTQ, AWQ) are usedRecovers most of the gap, the standard choice below 4 bits
    Iteration speedCheap to sweep many bit widths and granularitiesEach configuration is a separate training run

    Login to view more content
  • DL0089 RLHF: Human Feedback Training

    What is Reinforcement Learning from Human Feedback?

    Answer

    Reinforcement Learning from Human Feedback (RLHF) is a fine-tuning procedure that optimizes a language model against a learned model of human preferences instead of against a hand-written loss. It exists because the behaviors we actually want (helpful, honest, non-toxic, well-formatted answers) have no differentiable definition: next-token cross-entropy on scraped text rewards imitating the corpus, not satisfying a user. The standard recipe has three stages: supervised fine-tuning on demonstrations, training a reward model on human comparisons of pairs of responses, then optimizing the policy with an RL algorithm such as PPO against that reward, with a KL penalty pinning the policy near its starting point. Humans never grade individual tokens; they rank whole responses, and the reward model is the mechanism that turns those sparse rankings into a dense per-sequence training signal. InstructGPT is the canonical demonstration: labelers preferred outputs from the 1.3B InstructGPT model to those from the 175B pretrained GPT-3 base model despite roughly 100x fewer parameters, so the gain came from the objective rather than from scale.

    (1) Three-Stage Recipe: SFT → reward model → RL fine-tuning, where each stage consumes a different kind of human data (demonstrations, then comparisons, then only prompts).
    (2) Preferences Are Cheaper Than Demonstrations: asking “which of these two answers is better?” is faster and gives higher inter-annotator agreement than asking someone to write the ideal answer, and the Bradley-Terry model converts those binary comparisons into a scalar reward.
    (3) The KL Anchor Is Load-Bearing: the reward being optimized is a learned proxy, so the objective subtracts \beta times the KL divergence to the SFT reference policy; remove it and the policy walks off-distribution into text the reward model scores highly and humans hate.
    (4) Reward Hacking Is The Default Failure: proxy reward keeps rising while true human preference peaks and then declines, which is why production pipelines collect fresh comparisons on the current policy’s own samples rather than training once on a frozen dataset.

    Three-stage RLHF pipeline diagram: supervised fine-tuning on prompts plus demonstrations produces the reference policy, a reward model is trained on pairwise preference labels with the Bradley-Terry loss, and PPO optimizes the policy on prompts only against the frozen reward model minus a beta-weighted KL term, with a dashed path showing the SFT policy also serving as the KL anchor

    Figure 1: The three stages and the data each one needs. Stage 3 requires no new labels, only prompts, because the reward model has absorbed the human judgments, and the SFT checkpoint serves double duty as initialization and as the KL reference.

    The reward model is a copy of the transformer with the language-modeling head replaced by a scalar head, trained so that the preferred response scores higher than the rejected one. Because only differences of rewards appear in the loss, the reward scale and offset are unidentifiable, which is why RLHF implementations whiten or normalize rewards per batch before computing advantages. In stage 3 the policy samples completions for a prompt, the frozen reward model scores each one, and PPO takes a clipped policy-gradient step; the KL term is usually implemented as a per-token penalty folded into the reward rather than as a hard constraint. A naive PPO setup keeps four networks resident (policy, reference, reward model, value head), so memory and orchestration cost is the practical reason many teams reach for a direct preference method instead.

    Mathematical Formulation:
    \mathcal{L}_{RM} = -\log \sigma(r_\phi(x,y_w) - r_\phi(x,y_l))
    R(x,y) = r_\phi(x,y) - \beta \log \frac{\pi_\theta(y \mid x)}{\pi_{\mathrm{ref}}(y \mid x)}
    J(\theta) = \mathbb{E}_{x \sim \mathcal{D},\, y \sim \pi_\theta}[R(x,y)]

    Where:

    • \mathcal{L}_{RM} is the Bradley-Terry pairwise loss and \sigma is the logistic function, so the reward model is trained as a binary classifier over response pairs.
    • x is a prompt from the dataset \mathcal{D}, and y_w and y_l are the human-preferred and rejected responses to it.
    • r_\phi is the learned scalar reward model with parameters \phi; only reward differences are identified, so its absolute scale is arbitrary.
    • \pi_\theta is the policy being optimized and \pi_{\mathrm{ref}} is the frozen SFT policy; \beta > 0 sets how far the policy may drift, with typical values near 0.01 to 0.1.
    • R(x,y) is the KL-shaped reward actually fed to PPO, and J(\theta) is the on-policy objective, with the expectation taken over responses sampled from the current policy.
    Chart of reward versus KL divergence from the reference policy: the proxy reward model score rises monotonically with KL while the gold human preference score rises, peaks around 12 nats, and then declines, with a marker at the peak

    Figure 2: Illustrative overoptimization curve: the reward model score climbs without bound as the policy drifts, while measured human preference peaks and falls. \beta and early stopping exist to keep training left of that peak.

    AspectPPO-based RLHFDPOGRPO
    Separate reward modelYes, trained and frozenNo, the policy is its own implicit rewardYes, or a programmatic verifier
    SamplingOn-policy generation every stepOffline, fixed preference pairsOn-policy groups of responses per prompt
    Networks in memoryFour: policy, reference, reward, valueTwo: policy and referenceThree: no value network, group mean is the baseline
    Main failure modeReward hacking plus brittle PPO tuningStale data, drifts off the current policy distributionNoisy advantages when a whole group scores alike
    Best fitLarge budget, fresh labels, general helpfulnessFixed preference dataset, limited computeReasoning tasks with checkable answers

    Login to view more content
  • DL0088 PEFT: Parameter-Efficient Fine-Tuning

    Compare Parameter-Efficient Fine-Tuning (PEFT) methods: LoRA, adapters, and prompt/prefix tuning. When would you choose each?

    Answer

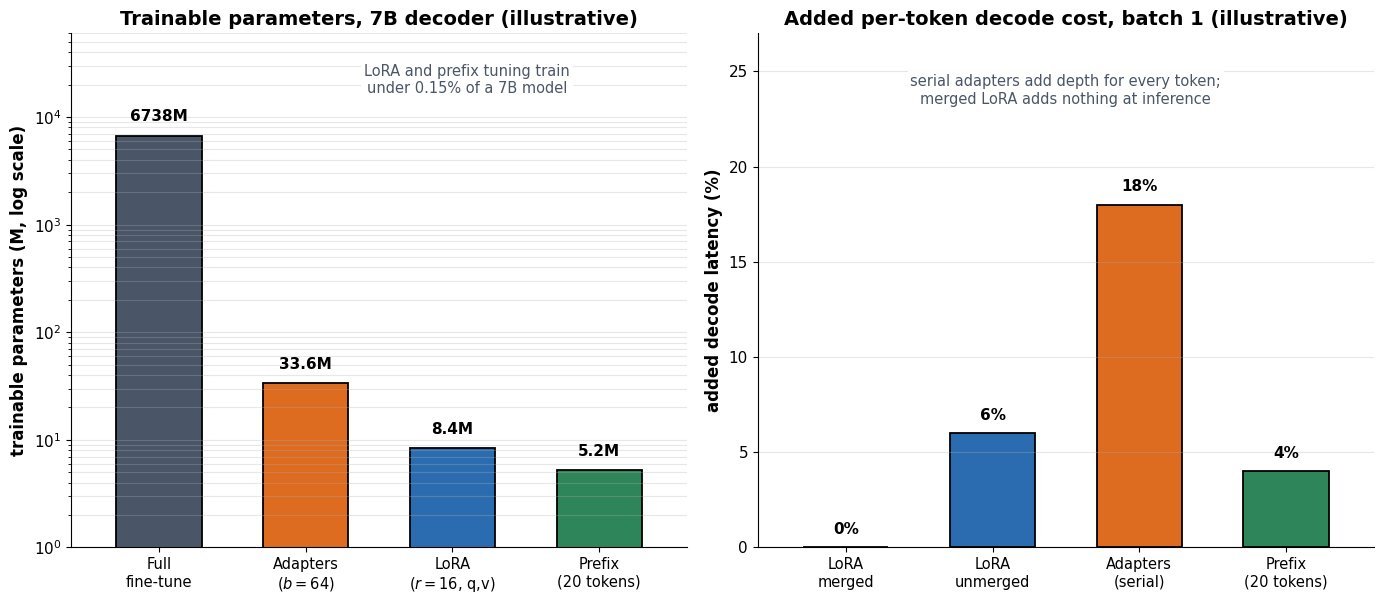
    All three families freeze the pretrained weights and train a tiny set of new parameters, but they differ in where those parameters live, and that single structural choice decides inference cost, serving flexibility, and achievable quality. LoRA adds a low-rank update in parallel to existing weight matrices, so after training the update folds back into W and costs exactly zero extra latency. Serial adapters insert a small bottleneck MLP inside the block’s forward path, which keeps task modules cleanly composable but adds depth, so every decoded token pays for them. Prefix and prompt tuning touch no weight matrix at all: prefix tuning prepends trainable key/value vectors at every layer, prompt tuning prepends trainable vectors only at the input embeddings, which is the cheapest option in parameter count but the least stable and it consumes context length. In practice LoRA is the default (paired with 4-bit quantization as QLoRA when GPU memory is the binding constraint), adapters win when modular composition matters more than latency, and prefix/prompt tuning wins when the base weights must stay byte-identical or when you want per-request conditioning.

    (1) Where The Parameters Live: LoRA sits parallel to chosen projections, adapters sit serially between sublayers, prefix tuning sits in the KV cache rather than in any weight tensor.
    (2) Mergeability Decides Latency: only LoRA is exactly mergeable into W_0; adapters add two matmuls and a nonlinearity per sublayer that cannot be folded away, which is a 10-25% decode overhead at batch 1 on a 7B model.
    (3) Capacity Is A Knob, Except For Prompts: rank r and bottleneck width b scale capacity smoothly, while prompt tuning’s capacity saturates and only becomes competitive with full fine-tuning above roughly 10B parameters.
    (4) Multi-Tenant Serving: unmerged LoRA and prefix tuning both support heterogeneous batching (per-request low-rank gather, or per-request KV prefix) from one frozen base copy; merged LoRA needs a separate weight copy per task and adapters need a weight swap per request.

    Diagram of one transformer block: input, LayerNorm, self-attention, LayerNorm, FFN, output. A blue LoRA box below attention taps the same input and adds its output back in parallel, a green prefix-tuning box above attention prepends trainable key and value vectors, and an orange serial adapter box sits in the path between the FFN and the block output

    Figure 1: The three injection sites in one block. LoRA is parallel and therefore mergeable, the adapter is serial and therefore always in the critical path (real adapter recipes place one after attention and one after the FFN), and prefix tuning changes only K and V, leaving every weight untouched.

    Two consequences are worth stating precisely because interviewers probe them. First, the merge is algebraically exact, not an approximation: W_0 + (\alpha/r)BA is just another matrix of the same shape, so a merged LoRA checkpoint is indistinguishable from a normally fine-tuned one at serving time, and the price is that you can no longer swap tasks without unmerging. Second, PEFT saves optimizer and gradient memory, not activation memory: with Adam you drop from roughly 12-16 bytes per trainable parameter of state to almost none, which is why a 7B model fine-tunes on a single 24GB card, but activations still scale with batch size and sequence length, and QLoRA’s 4-bit NF4 base plus paged optimizers is what pushes a 65B model onto one 48GB GPU. Prefix tuning has a third quirk: because the prefix occupies KV slots, a 20-token prefix at every layer permanently shortens the usable context and its quality is non-monotonic in prefix length, which is why the original work needed a reparameterization MLP to train stably at all.

    Mathematical Formulation:
    h = W_0 x + \frac{\alpha}{r} B A x
    W' = W_0 + \frac{\alpha}{r} B A
    h = x + W_{\mathrm{up}} \sigma(W_{\mathrm{down}} x)
    \tilde{K} = \mathrm{concat}(P_k, K)
    \tilde{V} = \mathrm{concat}(P_v, V)

    Where:

    • h is the sublayer output and x the input; W_0 is the frozen pretrained matrix of shape d_{out} \times d_{in}.
    • B \in \mathbb{R}^{d_{out} \times r} and A \in \mathbb{R}^{r \times d_{in}} are the LoRA factors with rank r \ll \min(d_{in}, d_{out}); A is Gaussian-initialized and B is zero-initialized so training starts from the pretrained function.
    • \alpha is a scaling constant, and the ratio \alpha/r keeps the effective update magnitude roughly stable when you sweep r; W' is the merged weight used at inference.
    • W_{\mathrm{down}} \in \mathbb{R}^{b \times d} and W_{\mathrm{up}} \in \mathbb{R}^{d \times b} form the adapter bottleneck of width b, with nonlinearity \sigma; the residual term x plus near-zero initialization makes the adapter an approximate identity at step 0.
    • P_k, P_v \in \mathbb{R}^{p \times d_k} are the per-layer, per-head prefix key and value vectors of length p; K, V are the ordinary projected keys and values, so attention runs over p + n positions for a sequence of length n.
    Two-panel bar chart. Left panel, log scale: trainable parameters for full fine-tuning 6738M, adapters 33.6M, LoRA 8.4M, prefix tuning 5.2M. Right panel: added per-token decode latency at batch 1, merged LoRA 0 percent, unmerged LoRA 6 percent, serial adapters 18 percent, prefix tuning 4 percent

    Figure 2: Illustrative budgets for a 7B decoder with d = 4096 and 32 layers. Parameter counts span three orders of magnitude, yet the latency picture is unrelated to them: the smallest method is not the fastest, and merged LoRA is free.

    DimensionLoRASerial AdaptersPrefix / Prompt Tuning
    Insertion pointParallel to chosen linear layers (q,v by default; all attention and FFN projections for hard tasks)Serial bottleneck after the attention and FFN sublayersExtra K/V vectors at every layer (prompt tuning: input embeddings only)
    Trainable share (7B)0.05-0.5% (8.4M at r=16 on q,v)0.5-3% (33.6M at b=64, two per layer)Under 0.1% (5.2M for a 20-token prefix)
    MergeableYes, algebraically exactNo, extra depth is irreducibleNo, but no weight is modified either
    Inference cost0% merged; roughly 5-10% unmerged at batch 1Roughly 10-25% at batch 1, worst at small batchSmall KV cost, but the prefix permanently shortens usable context
    Many tasks, one baseStrong: keep unmerged and batch a per-request low-rank gatherWeak: needs a per-request module swap, though AdapterFusion composes trained modulesStrong: a prefix is just cached K/V, trivially per-request
    Quality on hard tasksMatches full fine-tuning closely at adequate rank; underfits at very low r on large domain shiftsComparable to LoRA, with a well-studied bottleneck-width knobLags on generation and reasoning; unstable below roughly 10B parameters
    Choose it whenDefault choice; memory-bound runs pair it with 4-bit QLoRA; hundreds of task variants over one baseYou want modular, composable, independently versioned task modules and have latency headroomBase weights must stay immutable, or you need cheap per-request conditioning at very large scale

    Login to view more content
  • DL0087 QLoRA: 4-bit Quantized LoRA

    What is QLoRA, and how does it combine 4-bit quantization with LoRA?

    Answer

    QLoRA (Dettmers et al., 2023) is a fine-tuning recipe that keeps the entire base model frozen in 4-bit precision and trains only LoRA adapters in 16-bit on top of it, so the memory that would have held gradients and optimizer state for billions of parameters simply never gets allocated. During the forward pass each 4-bit weight block is dequantized to bf16 on the fly, used for the matrix multiply, and discarded; the backward pass dequantizes again to propagate gradients through the frozen weights into the adapters, which are the only tensors that receive updates. Three components make the 4-bit base workable: the NF4 data type, which places its 16 levels at quantiles of a normal distribution rather than uniformly, double quantization of the per-block scaling constants, and paged optimizers that offload optimizer state through unified memory when a long-sequence step spikes. The headline result was fine-tuning a 65B model on a single 48 GB GPU while matching 16-bit LoRA quality on instruction-following benchmarks. Note that QLoRA quantizes the frozen base, never the adapters or the gradients, so all learning still happens in bf16.

    (1) NF4 (4-bit NormalFloat): pretrained weights within a block are approximately zero-centered Gaussian, so NF4 spaces its levels at quantiles of a standard normal instead of uniformly, which is information-theoretically optimal for that assumption and beats 4-bit float or int at equal bit width.
    (2) Blockwise Absmax Scaling: weights are quantized in blocks of 64 with one absmax constant per block, which localizes outliers so a single large weight cannot crush the resolution of an entire tensor.
    (3) Double Quantization: those constants are themselves quantized to 8-bit with a second-level fp32 scale per 256 constants, cutting the metadata overhead from 0.5 to about 0.127 bits per parameter (roughly 3 GB on a 65B model).
    (4) Only Adapters Train: gradients pass through the frozen 4-bit weights but are stored only for A and B, so optimizer state scales with the adapter rank, not with model size.
    (5) Paged Optimizers: optimizer states live in NVIDIA unified memory and are paged to host RAM during transient spikes, which is what keeps a 33B or 65B single-GPU run from OOM-ing on a long batch.

    Block diagram of a QLoRA linear layer: input X feeds a frozen NF4 base weight with its double-quantized absmax constants, which is dequantized to bf16 for the matmul, while a parallel bf16 LoRA A and B path scaled by alpha over r is added to produce output Y, with dashed gradient arrows returning only into A and B

    Figure 1: One QLoRA linear layer. The NF4 weight and its quantization constants are read-only, the bf16 copy exists only for the duration of the matmul, and the dashed path shows that gradients terminate at the low-rank adapters.

    Mathematical Formulation:
    Y = X\,\mathrm{dq}(W_4) + \frac{\alpha}{r}\,X A B
    \mathrm{dq}(W_4)_{ij} = c_i\,z_{q_{ij}}
    c_i = \mathrm{absmax}(W_i)
    b = 4 + \frac{8}{64} + \frac{32}{64 \cdot 256}
    b \approx 4.127\ \text{bits per parameter}

    Where:

    • Y is the layer output and X the bf16 input activation; both stay in 16-bit throughout.
    • W_4 is the frozen base weight stored as NF4 indices, and \mathrm{dq} is the dequantization that reconstructs a bf16 tile just before the matmul.
    • i indexes the blocks of 64 weights, q_{ij} \in \{0,\ldots,15\} is the stored 4-bit code, and z_k are the fixed NF4 levels, obtained from normal quantiles and rescaled to [-1, 1] with an exact zero.
    • c_i is the per-block absmax constant; double quantization stores it in 8 bits with one fp32 scale per 256 constants.
    • A \in \mathbb{R}^{d \times r} and B \in \mathbb{R}^{r \times k} are the trainable bf16 adapters of rank r (the paper uses r = 64 on every linear layer), scaled by \alpha / r; B starts at zero so the layer initially reproduces the quantized base model.
    • b is the effective storage cost per base parameter: 4 bits of payload plus 0.125 bits of 8-bit constants plus 0.002 bits of second-level scales.
    Horizontal stacked bar chart of training memory for a 7B model: full fine-tuning totals 112 GB with 14 GB weights, 14 GB gradients and 84 GB optimizer states; 16-bit LoRA totals 16.6 GB; QLoRA totals 6.2 GB with a 3.6 GB NF4 base

    Figure 2: Illustrative state memory for a 7B model with rank-64 adapters on all linear layers. LoRA removes the optimizer and gradient bulk, and QLoRA then shrinks the remaining frozen weights from 14 GB to 3.6 GB; activation memory is excluded.

    AspectQLoRA (NF4 base)16-bit LoRAFull Fine-Tuning
    Base weight storageNF4, about 4.13 bits per parameter with double quantizationbf16, 16 bits per parameterbf16 weights plus an fp32 master copy
    Trainable parameters (7B)About 160M in bf16 at rank 64 on all linear layersIdentical adapter countAll 7B parameters
    State memory (7B)About 6 GBAbout 17 GBAbout 112 GB, needs sharding across GPUs
    Step timeSlowest: dequantization runs in both forward and backwardFastest of the two adapter methodsHighest total compute and communication
    Instruction-tuning qualityMatches 16-bit LoRA when adapters cover every linear layerReference point for adapter tuningPreferred with very large in-domain corpora or heavy domain shift
    DeploymentAdapter cannot fold into NF4 losslessly; merge into the 16-bit base, then requantizeMerge into bf16 weights for zero added latencyOne merged checkpoint per task

    Login to view more content