ML0016 AUC

What is AUC?

Answer

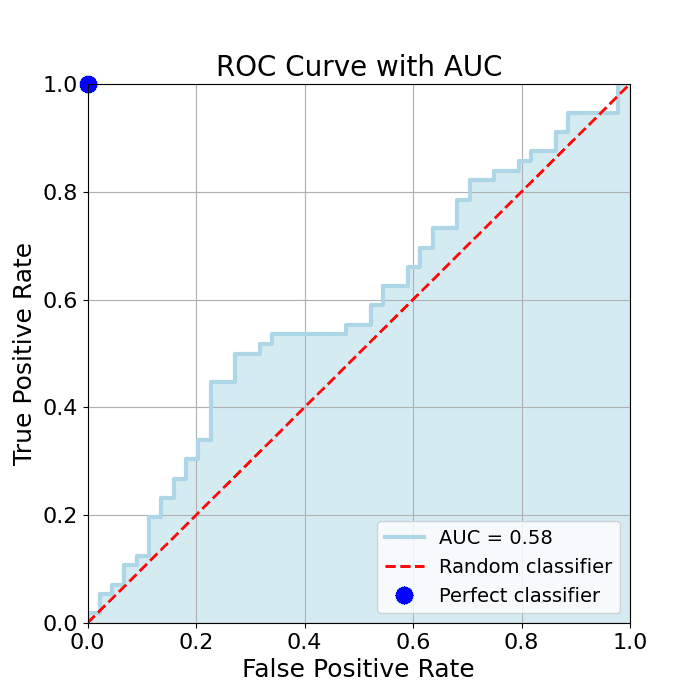
AUC (Area Under the Curve) measures a binary classifier’s ability to distinguish between the positive and negative classes, computed as the area under its ROC curve, the curve that trades off true positive rate against false positive rate across all thresholds. Its value ranges from 0 to 1: 1.0 is a perfect classifier, 0.5 is random guessing (the diagonal), and below 0.5 is worse than random, which rarely happens and can be flipped into a better model. AUC’s advantages: it is threshold-independent, summarizing performance over every decision threshold at once; it handles imbalanced data well because it evaluates the ranking of predictions rather than absolute counts; and it gives an intuitive single number for comparing different models.

(1) Definition: The area under the ROC curve: one scalar summarizing threshold-free discrimination.
(2) Probabilistic Meaning: AUC equals the probability that a random positive scores higher than a random negative.
(3) Reading The Scale: 1.0 perfect, 0.5 random, below 0.5 inverted.

ROC curve with the area under it shaded and AUC value labeled

Figure 1: AUC is literally the shaded area under the ROC curve; the wider the curve bows toward the top-left corner, the larger the area.

Mathematical Formulation:
\text{AUC} = P\big(s(x^{+}) > s(x^{-})\big)
\text{AUC} = \int_{0}^{1} \text{TPR}(\text{FPR}) \, d\text{FPR}

Where:

  • s(x) is the model’s score (e.g., predicted probability) for sample x.
  • x^{+} is a randomly chosen positive sample and x^{-} a randomly chosen negative one.
  • \text{TPR}(\text{FPR}) is the ROC curve itself, true positive rate as a function of false positive rate.
  • The two lines are equivalent: the geometric area (integral) equals the pairwise-ranking probability, which is why AUC measures ranking quality.

Login to view more content


Log in to track your progress

Comments

Leave a Reply

Your email address will not be published. Required fields are marked *