Tag: Transformer

  • DL0142 OCR-Free Document VLM

    How do OCR-free Document VLMs process complex multi-column PDFs, tables, and infographics compared to multi-stage OCR pipeline setups?

    Answer

    A multi-stage pipeline turns a page into a text document before any reasoning happens: rasterize → detect text regions → recognize each crop → classify layout blocks → sort them into reading order → recover table cell structure → serialize to Markdown or HTML → feed a text LLM. An OCR-free Document VLM deletes that entire chain and treats the page as an image: a dynamic-resolution ViT encoder cuts the raster into 14×14 patches, a 2×2 pixel-shuffle merge collapses them into one visual token per 28×28 pixel block, and a decoder-only LLM attends over those tokens to emit the answer, the Markdown, or the HTML table directly. The consequence is that self-attention itself becomes the layout model: column boundaries, cell alignment, chart axes, and legend-to-series association are learned from pixels rather than reconstructed by six independently trained components whose errors multiply. What you gain is robustness on infographics and rotated or borderless tables, where reported scores such as Qwen2.5-VL-72B’s roughly 96 ANLS on DocVQA and roughly 87 on InfographicVQA are far out of reach for a serialized-text pipeline. What you lose is character-level coordinates, per-token confidences, and cheap per-page cost, because a single A4 page at 150 DPI already costs about 2,835 visual tokens and the prefill over them is quadratic.

    (1) Pixels In, Structure Out: the model never sees a text layer, so scanned pages, screenshots, and born-digital PDFs with broken embedded fonts all take the identical path.
    (2) Dynamic Resolution Tokenization: instead of squashing every page to 224×224, the encoder keeps native aspect ratio and resolution, so an 8 pt footnote survives as its own tokens rather than being blurred away.
    (3) Attention Replaces The Reading-Order Module: a three-column paper needs no LayoutReader-style sorter, because the decoder learns column continuation the way a language model learns syntax.
    (4) Tables As Generated Markup: structure recognition becomes ordinary autoregressive decoding of HTML or Markdown, which handles borderless and spanning cells but has no per-cell confidence.
    (5) No Error Compounding, No Coordinates: the pipeline’s five or six stages multiply their error rates, while the VLM has one loss and one failure surface but cannot tell you where on the page an answer came from.
    (6) Token Budget Is The Real Constraint: visual tokens grow with the square of DPI, so resolution, tiling, and page count trade directly against context and O(N^2 d) prefill.

    Two horizontal lanes compared on the same rasterized page: the upper lane shows a six-stage OCR pipeline running text detection, crop recognition, layout analysis with reading order, table structure recognition, and Markdown serialization into a text LLM, annotated with compounding per-stage error; the lower lane shows an OCR-free VLM with a dynamic-resolution ViT patch encoder, a 2x2 pixel-shuffle merge producing 2,835 visual tokens, and a decoder-only LLM emitting the answer or an HTML table

    Figure 1: The same pixels, two failure surfaces. The pipeline produces an intermediate text document with coordinates that any downstream model can consume and any auditor can overlay, at the cost of five models whose accuracies multiply. The VLM is one differentiable stack with one loss, and its output carries no character boxes at all unless the model was explicitly trained to emit them.

    The three hard document classes fail differently. On multi-column PDFs, a pipeline’s mistake is almost never recognition, it is serialization: a two-column paper with a full-width figure caption in the middle gets flattened into interleaved half-sentences, and the LLM downstream has no way to recover the intended order because the evidence, the geometry, was discarded. On tables, borderless layouts and spanning header cells break rule-based and detection-based structure recognition, whereas a VLM trained on HTML targets can emit rowspan and colspan because it saw the whole grid at once. On infographics and charts, OCR returns a bag of strings with no relations, so “which bar is tallest” or “what does the dashed series do after 2021” is unanswerable from the transcript; this is precisely where the ChartQA and InfographicVQA gaps are widest. The pipeline still wins wherever the requirement is verbatim fidelity plus provenance, since a hallucinated digit inside a generated table cell is indistinguishable from a correct one, while a low-confidence OCR crop announces itself.

    Mathematical Formulation:
    N_{tok} = \lceil H/p \rceil \times \lceil W/p \rceil
    N_{tok} = 63 \times 45 = 2835
    C_{prefill} = O(N_{tok}^2 d)
    A_{pipe} = \prod_{k=1}^{K} a_k
    A_{pipe} = 0.95^5 \approx 0.77

    Where:

    • N_{tok} is the number of visual tokens the encoder emits for one page, which is what actually enters the LLM context.
    • H and W are the rasterized page height and width in pixels (1754 \times 1240 for A4 at 150 DPI), and p = 28 is the effective patch stride after a 2×2 merge of 14×14 patches.
    • C_{prefill} is the attention cost before the first output token, quadratic in N_{tok} and linear in model width d; the KV cache grows linearly, so a 20-page document is a memory problem as well as a compute one.
    • a_k is the per-page success rate of pipeline stage k and K the number of stages, with k \in \{1,\ldots,K\} running detection, recognition, layout, reading order, and table structure.
    • A_{pipe} is the end-to-end page accuracy: five stages that each succeed 95% of the time leave only about 77% of pages fully clean, and this multiplicative compounding is the structural argument for a single-stage model.
    Log-scale chart of tokens per A4 page versus rasterization DPI from 72 to 420: a curve for visual tokens after 2x2 pixel-shuffle merge rising quadratically from about 640 at 72 DPI to about 21500 at 420 DPI, a four-times-higher curve for raw 14x14 patches without merging, and a flat line at about 800 tokens for serialized OCR text, with a horizontal marker at the 16384-token per-image cap and a vertical dashed line at 150 DPI

    Figure 2: Resolution is the cost knob. The same A4 page costs 2,835 visual tokens at 150 DPI and 11,214 at 300 DPI, roughly 4x the tokens and 16x the prefill FLOPs, while a serialized OCR transcript of that page stays near 800 tokens whatever the DPI. The 2×2 pixel-shuffle merge is what keeps a full page under the common 16,384-token per-image cap at all.

    PropertyMulti-stage OCR pipelineOCR-free Document VLM
    Multi-column reading orderExplicit sorter over layout blocks; interleaves columns when a full-width element splits the pageLearned implicitly by attention over the whole page at once
    TablesDedicated structure model emitting cell boxes; weak on borderless and spanning cellsGenerates HTML with rowspan and colspan; can silently drop or invent rows in long tables
    Charts and infographicsReturns unrelated strings; visual relations such as legend-to-series are lostReads axes, bar heights, and legends jointly, which is where the accuracy gap is largest
    ProvenanceCharacter and word boxes plus per-crop confidence, usable for redaction and highlightingNone by default; needs grounding training to emit absolute coordinates
    Dominant failure modeCompounding stage errors and serialization scrambling; degrades visiblyFluent hallucination and repetition loops; degrades invisibly
    Cost per pageSmall CNN and CTC models, CPU-viable, millions of pages per day cheaplyThousands of visual tokens through a multi-billion-parameter decoder with quadratic prefill
    Adapting to a new form typeRetrain or rewrite whichever stage broke, with per-stage labelsFine-tune once on image and target-string pairs, no intermediate annotation

    Login to view more content
  • DL0141 Visual Token Compression for OCR

    How do visual token compression techniques reduce the sequence length of visual inputs without degrading fine-grained OCR performance?

    Answer

    The techniques that survive contact with documents all compress along the channel axis rather than the token axis: a pixel unshuffle (InternVL) or a strided convolutional reducer (DocOwl 1.5) folds each s \times s block of patch embeddings into one vector of width s^2 d and projects it back to d, so four patches become one token while the patch-to-region mapping stays bijective and no pixel is discarded. The second half of the recipe is that the token budget must keep scaling with input resolution: dynamic tiling and native-resolution patching (Qwen2-VL) give a 1275×1650 scan roughly 2,600 tokens of 28×28 pixels each, whereas a fixed-K resampler hands the same page 64 tokens no matter how many glyphs it contains. What actually kills OCR is rarely the compressor itself but the resize step in front of it: squeezing a page into 336×336 makes an 11 pt glyph thinner than one 14-pixel patch, and no downstream module can recover strokes the encoder never sampled. The useful mental model is glyph density: keep the number of glyphs covered by a single visual token near one, and compression is nearly free; push it toward ten and character-level accuracy falls off a cliff while scene-level captioning barely moves.

    (1) Compress Channels, Not Positions: pixel unshuffle and conv reducers move information into the feature dimension, so a 4\times length reduction still lets every output token point at a known rectangle of the page.
    (2) Keep The Budget Resolution-Dependent: a compression ratio is safe, a compression target is not; dynamic tiling plus native-resolution patching lets a dense page buy more tokens than a photo of a beach.
    (3) Respect Glyph Nyquist: the binding constraint is stroke width versus patch size in the resized image, which is why 336-pixel inputs cap document accuracy regardless of the connector.
    (4) Fixed-Query Resamplers Lose The Wrong Thing First: K learned queries cross-attend to all patches without a positional index, so reading order and rare characters degrade before object-level semantics do.
    (5) Two-Scale Views Are Cheap: a global thumbnail supplies layout while local tiles supply glyphs, which is why AnyRes-style designs use 4 \times 576 + 576 = 2880 tokens rather than one giant grid.
    (6) Prune Late And Query-Aware: dropping half the visual tokens after LLM layer 2 (FastV) saves about 45% of prefill FLOPs on scene VQA but deletes whole text lines when the question has not yet been attended to.

    Three-row diagram comparing visual token compression families on the same 8 by 4 patch grid: the top row folds each 2 by 2 block of patches into one token on the channel axis and produces a 4 by 2 output grid with matching tints, the middle row sends all patches through cross-attention into four fixed learned query tokens with no positional index, and the bottom row keeps the original grid but marks half the cells as dropped by an attention score

    Figure 1: Same patch grid, three compression axes. Only the top row keeps an exact mapping from output token back to page rectangle, which is what OCR decoding depends on; the middle row replaces that mapping with K content-addressed slots, and the bottom row keeps positions but deletes evidence.

    Why the distinction matters becomes obvious once you count information. Natural images are locally redundant, so averaging neighbouring patches costs almost nothing; a page of text is close to the opposite, since each glyph is a high-entropy symbol whose identity cannot be inferred from its neighbours and whose position carries the reading order. A learned resampler is a query-agnostic bottleneck: it must decide what to keep before the question arrives, and a fixed 64-slot budget forces it to summarise, which is exactly the wrong operation for text. Structured merging instead makes a bounded, uniform trade, and empirically the boundary sits near one glyph per token. The design lineage of production VLMs follows that logic directly: Q-Former resamplers → pixel unshuffle with dynamic tiles → native dynamic resolution with a 2×2 patch merger, each step trading a smaller guaranteed budget for a budget that grows with how much text is actually on the page.

    Mathematical Formulation:
    N_p = \dfrac{HW}{p^2}
    N_v = \dfrac{N_p}{s^2} = \dfrac{HW}{p^2 s^2}
    A = \dfrac{H_0 W_0}{N_v}
    c = \dfrac{G}{N_v}
    \mathrm{prefill} = O((N_v + N_t)^2 d)

    Where:

    • N_p is the patch count the vision encoder produces from a resized input of size H \times W with patch size p, and N_v is the number of tokens actually handed to the language model.
    • s is the spatial merge factor; pixel unshuffle with s=2 concatenates 4 patch embeddings into width 4d and projects back to d, so length drops 4\times with no averaging.
    • H_0 \times W_0 is the original page resolution and A the original pixels covered by one visual token, which is the honest measure of compression because the resize is itself a compressor.
    • G is the glyph count on the page and c the glyphs per visual token; c \approx 1 is the practical safety line for character-accurate reading.
    • N_t is the text prompt length and d the model width, so prefill is quadratic in the combined sequence while the KV cache grows linearly.

    Worked Example, One Dense A4 Page At 150 DPI:
    N_v = 4 \times 576 + 576 = 2880
    c = 3200 / 2880 \approx 1.1
    c = 3200 / 576 \approx 5.6
    (2880 / 576)^2 = 25

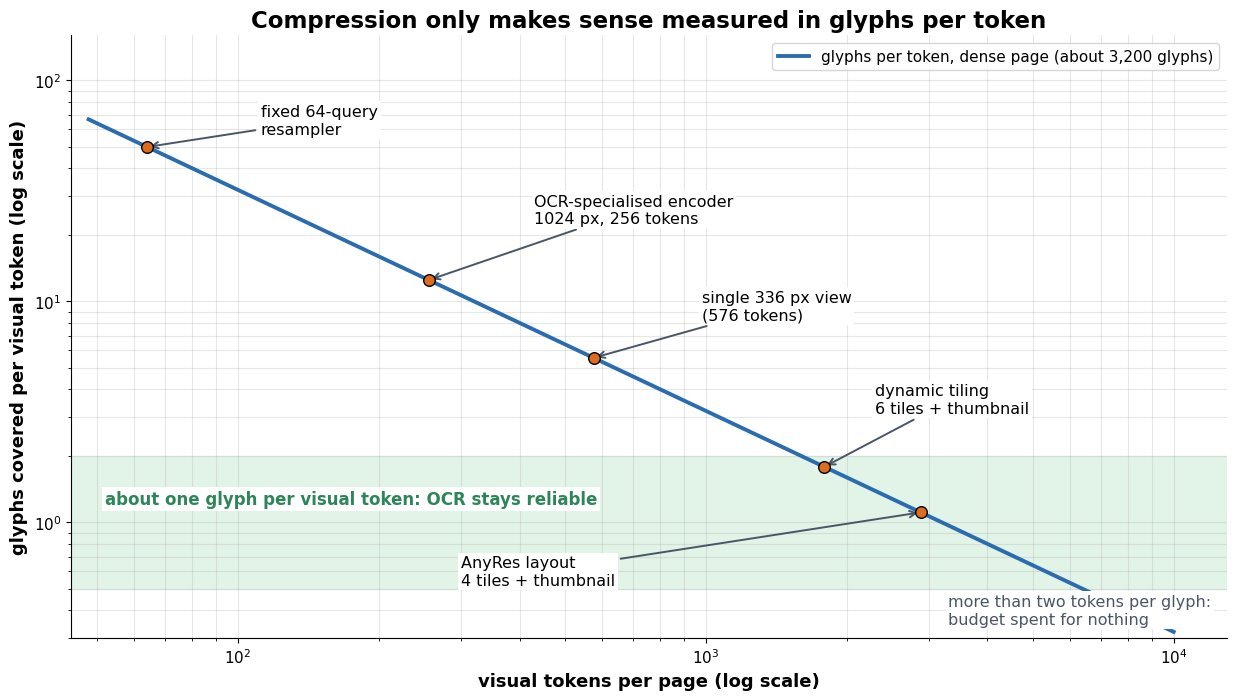
    Assuming about 3,200 glyphs on the page, an AnyRes layout of four 336-pixel tiles plus a thumbnail lands at roughly one glyph per token, while a single 336-pixel view lands at 5.6 and reads only headlines. The last line is the bill: those extra tokens cost 25 times the attention work in prefill, which is precisely why the compressor exists and why the interesting engineering is choosing the smallest N_v that still keeps c near 1 for the document class you serve.

    Log-log line chart of glyphs covered per visual token versus visual tokens per page for a dense page of about 3200 glyphs, with a shaded horizontal band between 0.5 and 2 glyphs per token marked as the reliable OCR region, and annotated markers at 64 tokens for a fixed-query resampler, 256 tokens for an OCR-specialised encoder, 576 tokens for a single 336 pixel view, 1792 tokens for dynamic tiling with a thumbnail, and 2880 tokens for an AnyRes layout

    Figure 2: Compression is only meaningful relative to glyph density. Configurations inside the band give each visual token roughly one character and read reliably; a 64-slot resampler asks one token to encode about 50 glyphs. Systems trained specifically for optical text compression can operate right of the band, but at a measured precision cost, and below the band extra tokens buy nothing.

    PropertySpatial channel mergeFixed-query resamplerIn-LLM pruning or merging
    MechanismPixel unshuffle or strided conv over the patch grid, then a linear projectionCross-attention from K learned queries into all patch embeddingsRank tokens by attention received in an early layer, drop or merge the tail
    Budget vs resolutionGrows linearly with pixels, fixed ratio of 4x or 16xConstant at K (typically 32 to 256) whatever the input sizeGrows with pixels, then cut by a fixed keep-rate
    Spatial index keptYes, one token maps to one known rectangleNo, slots are content-addressed and order must be relearnedYes for survivors, but dropped regions leave holes
    Training costOne small projection, trained with the connectorA full extra transformer stage plus alignment pretrainingUsually training-free, applied at inference
    Dominant failureLong context and quadratic prefill on multi-page inputsReading order and rare glyphs collapse on dense pagesWhole text lines vanish when the query is not yet visible to the scorer

    Login to view more content
  • DL0140 Temporal Visual Grounding

    What are the challenges of temporal visual grounding (predicting the start and end timestamps of a language query inside a long, untrimmed video, as in video search features built on models like InternVideo2 or TimeChat)?

    Answer

    Temporal visual grounding (also called temporal sentence grounding or moment retrieval) maps one natural-language query onto a single interval (s, e) inside an untrimmed video, and almost every difficulty follows from one mismatch: the metric is far more precise than the signal you can afford to look at. Benchmarks report R@1 at IoU 0.7 against a human-drawn span, yet the target moment is often a few percent of a video that runs for minutes, its boundaries are genuinely ambiguous (annotators disagree by seconds about when “opens the fridge” starts), supervision is a single positive span among thousands of candidate windows, and compute forces you to subsample frames so hard that the achievable temporal resolution can be coarser than the tolerance the metric grants. Worse, the standard datasets carry strong temporal location priors, so a model that never looks at the video can score respectably and mask the fact that no grounding is happening at all. Cross-modal features add their own problem, because image-level encoders describe objects well and describe verbs, ordering, and completion poorly, which is exactly the information a query like “right after he sits down” depends on.

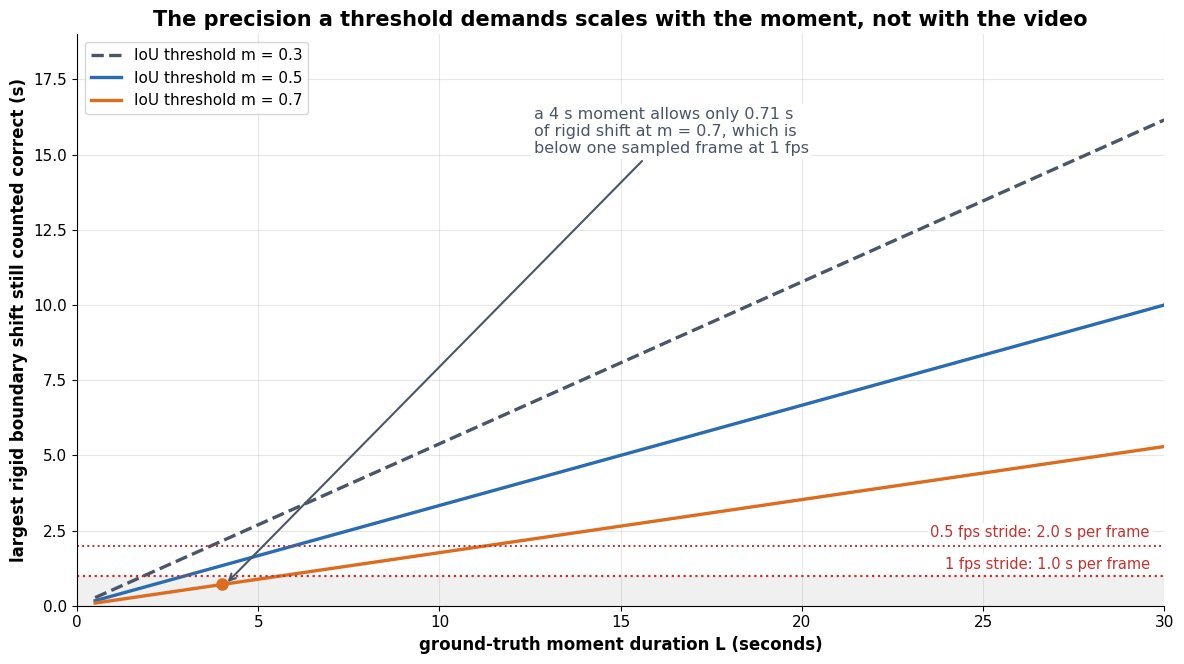
    (1) Tolerance Scales With The Moment, Not The Video: at m = 0.7 a correctly sized 4-second moment tolerates a rigid boundary shift of only 0.71 s, so short moments demand sub-second precision while long ones are almost free.
    (2) Boundary Ambiguity Lives In The Labels: event onsets and offsets are not crisp, so inter-annotator IoU sits well below 1.0 and an L1 boundary regression fits annotation noise past a certain accuracy.
    (3) Sampling Stride Trades Precision Against Cost: sampling at f fps sets a hard error floor near 1/(2f) seconds, but keeping f high makes N = fT large and early cross-modal fusion costs O(N^2).
    (4) Features Are Weak On Temporal Semantics: frozen CLIP-style per-frame embeddings encode appearance, so verbs, order, and “before/after” relations are nearly invisible without motion-aware or video-pretrained features.
    (5) Location Priors Let Blind Models Win: on Charades-STA and ActivityNet Captions the ground-truth spans cluster in predictable places, so query-only or prior-only baselines are competitive and out-of-distribution splits expose the gap.
    (6) Supervision Is Sparse And Assumes One Span: a single positive interval creates extreme foreground/background imbalance, and queries matching several disjoint intervals or none at all break single-span heads outright.

    Line chart of the largest rigid boundary shift still counted correct versus ground-truth moment duration, for IoU thresholds 0.3, 0.5 and 0.7, with dotted horizontal lines marking the resolution floors of 1 fps and 0.5 fps sampling; short moments at threshold 0.7 fall below the 1 fps floor

    Figure 1: The tolerance the metric grants is proportional to the moment duration, so a strict threshold on short moments asks for a precision that the frame sampling stride cannot deliver. Below the dotted lines, the demanded accuracy is finer than one sampled frame, and no amount of head tuning recovers it.

    Mathematical Formulation:
    I = \max(0,\ \min(\hat{e}, e) - \max(\hat{s}, s))
    U = \max(\hat{e}, e) - \min(\hat{s}, s)
    \mathrm{IoU} = I / U
    \delta \leq \frac{1 - m}{1 + m}\, L
    \mathrm{Acc}_{m} = \frac{1}{Q} \sum_{q=1}^{Q} \mathbf{1}[\mathrm{IoU}_{q} \geq m]
    \mathcal{L} = \lambda_{1} \lVert \hat{b} - b \rVert_{1} + \lambda_{2} (1 - \mathrm{IoU})
    N = f\,T

    Where:

    • (s, e) is the annotated span and (\hat{s}, \hat{e}) the prediction, both in seconds; I and U are the 1D intersection and union, and the \max(0, \cdot) handles disjoint spans.
    • L = e - s is the ground-truth duration, m the IoU threshold, and \delta the largest rigid shift of both boundaries that still passes, obtained from (L - \delta)/(L + \delta) \geq m.
    • q \in \{1, \ldots, Q\} indexes queries and \mathrm{Acc}_{m} is the usual R@1, IoU=m metric, a hard indicator that is flat inside the tolerance band and gives no gradient-like signal about how close a miss was.
    • b = (s, e) normalized by video length, \lambda_{1} and \lambda_{2} the loss weights; the L1 term is scale-sensitive and the IoU term is scale-free, which is why both appear in DETR-style grounding heads.
    • T is the video duration, f the sampling rate, and N the number of frame tokens; a 20-minute video at f = 1 gives N = 1200, and self-attention over it costs O(N^2) per query.

    The design space has moved through three families and is now entering a fourth: sliding-window proposal ranking (dense candidate spans scored against the query, as in 2D-TAN), proposal-free span prediction (per-frame start and end distributions, as in VSLNet), DETR-style set prediction (learnable moment queries plus Hungarian matching with an L1 and IoU loss, as in Moment-DETR and CG-DETR), and video LLMs that emit timestamps as text or as dedicated time tokens. Each family inherits the same structural problems in a different shape: proposal methods make the imbalance explicit and cap resolution at the window grid, span prediction is cheap but assumes exactly one contiguous answer, set prediction handles multiple moments and a no-moment class but needs enough data to learn the matching, and LLM-based grounders quantize time into a token vocabulary and therefore trade fine boundary precision for reasoning ability. Scaling to hour-long input is a separate axis, because early fusion concatenates query and video tokens and blows up memory with N, while late fusion keeps the video encoding query-independent so features can be cached and reused across thousands of queries.

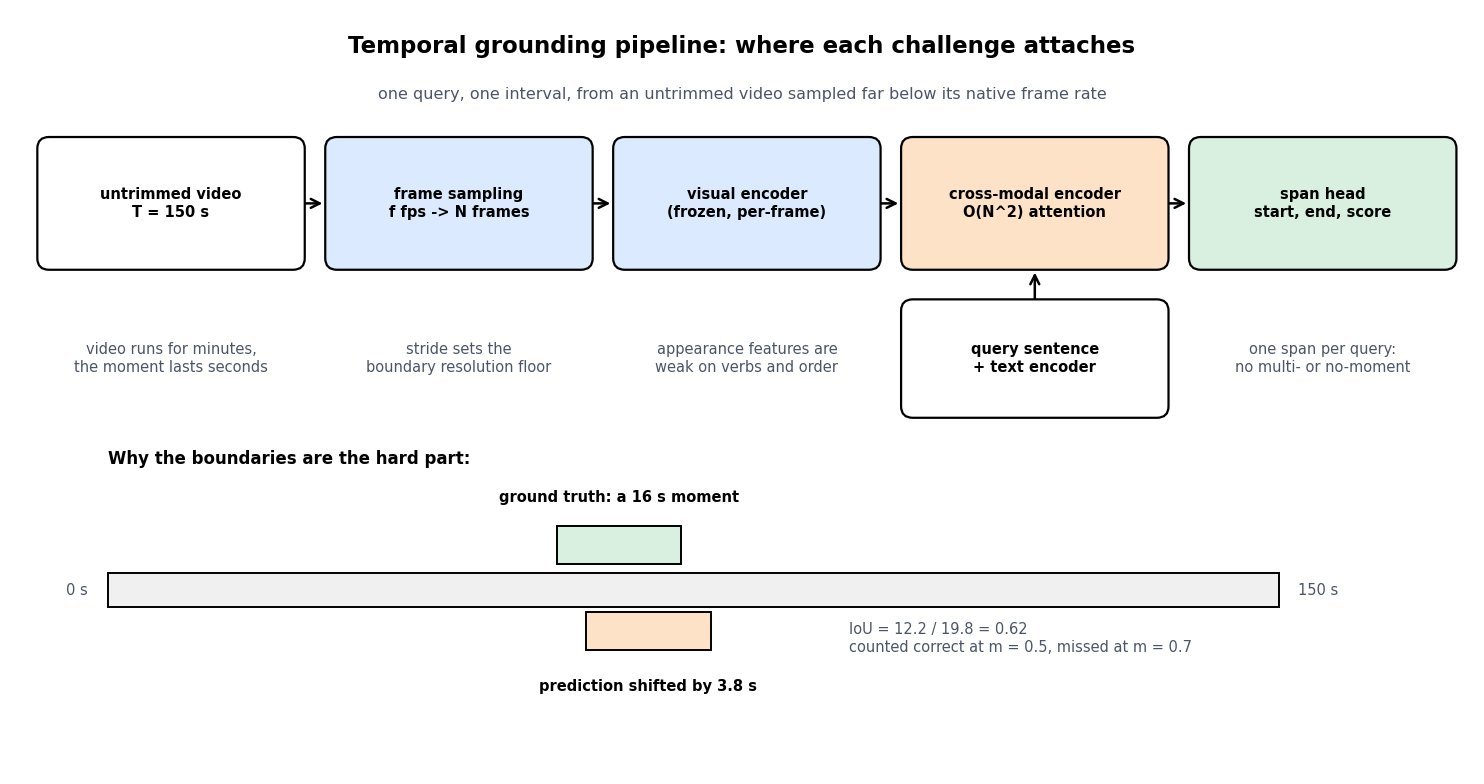
    Pipeline diagram of a temporal grounding model: untrimmed video, frame sampling at f fps, frozen per-frame visual encoder, cross-modal encoder with quadratic attention, and a span head emitting start, end and score, with the query sentence and text encoder feeding into the cross-modal stage; a challenge callout sits under each stage, and a bottom timeline compares a ground-truth 16 second moment against a prediction shifted by 3.8 seconds giving IoU 0.62

    Figure 2: Each pipeline stage contributes its own failure mode: the sampling stride fixes the resolution floor, the frozen per-frame encoder discards motion and ordering, early fusion makes cost quadratic in frame count, and a single-span head cannot express multiple or absent moments. The bottom timeline shows why the threshold choice dominates reported numbers: the same prediction passes at m = 0.5 and fails at m = 0.7.

    PropertyCharades-STAActivityNet CaptionsQVHighlightsMAD
    Typical video lengthabout 30 sabout 120 s150 s clipsfull movies, about 110 min
    Typical moment lengthabout 8 sabout 36 stens of secondsabout 4 s
    Moment share of videoroughly a quarterroughly a thirdsmall but non-trivialwell under 0.1 percent
    Moments per queryoneoneoften several disjointone
    Dominant difficultystrong location prior, blind baselines score welllong vague spans, annotation biasset prediction plus saliency, no-moment casesextreme needle in a haystack, memory and caching

    Login to view more content
  • DL0139 Multi-Camera Video VLM

    How do multi-camera video VLMs fuse visual inputs across asynchronous camera feeds with overlapping fields of view, as in Waymo’s surround-camera perception stack?

    Answer

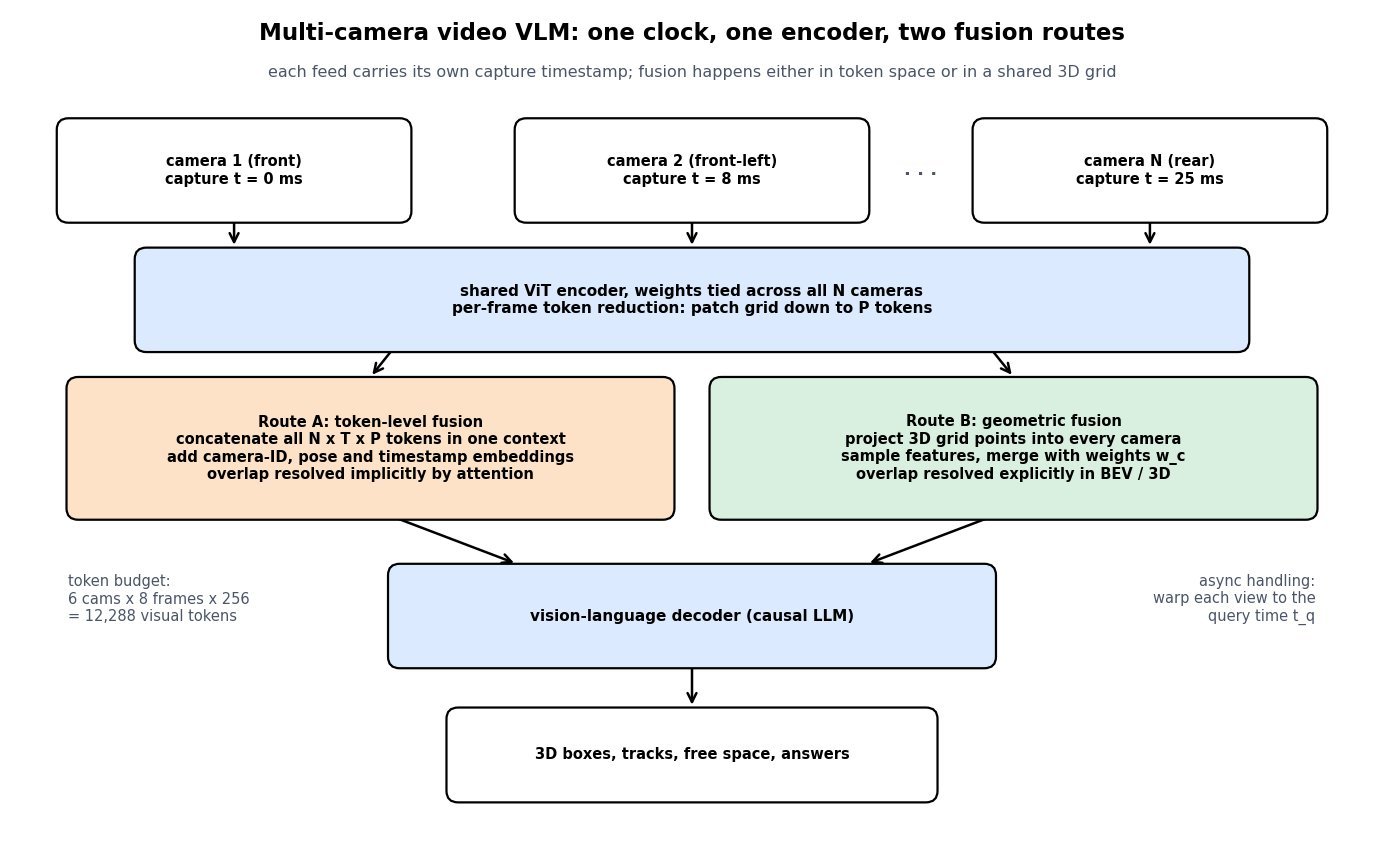
    Fusion is three separate problems solved in a fixed order: time alignment, per-view encoding, then spatial merging. Production rigs first put every camera on one clock (PTP or GPS-locked triggers) and stamp each frame with its own capture time, because software receive time is meaningless at 30 fps. Each view is then encoded independently by a weight-shared ViT and compressed to a small token set per frame, since the raw budget is multiplicative: 6 cameras at 8 frames of 256 tokens each is 12{,}288 visual tokens before a single word of the prompt. The merge itself comes in two families. Token-level fusion concatenates all view tokens into one LLM context and tags each token with a camera-identity, extrinsic-pose, and timestamp embedding, letting attention discover the cross-view correspondence itself; this is the route taken by surround-view multimodal models such as Waymo’s EMMA. Geometric fusion instead defines 3D query points (BEV cells or object queries), projects each one into every camera using calibrated intrinsics and extrinsics warped by ego motion to a common query time, and merges the sampled features with per-camera weights, so a point seen by two overlapping cameras is fused once rather than described twice.

    (1) One Clock Before Anything Else: hardware-triggered PTP or GPS sync plus a per-frame capture timestamp is the prerequisite; without it every downstream geometric step inherits an unknown offset.
    (2) Shared Encoder Per View: one ViT with tied weights runs on all N views, followed by token reduction (pooling, a Q-Former, or a perceiver resampler) to keep the context finite.
    (3) Token-Level Fusion Is Implicit: concatenate everything and add camera-ID, pose, and time embeddings; flexible and calibration-tolerant, but the model must learn that two tokens describe the same object.
    (4) Geometric Fusion Is Explicit: project each 3D query point into every camera and merge samples with confidence weights, which deduplicates the overlap region by construction.
    (5) Asynchrony Is A Pose Problem: each view is warped by the ego transform between its own capture time and the query time t_q, so odometry or IMU quality bounds fusion accuracy.
    (6) Token Budget Dominates Cost: tokens grow as N \cdot T \cdot P while self-attention grows as O(L^2), so doubling the camera count quadruples attention FLOPs.
    (7) Overlap Weighting Prevents Double Counting: weights derived from depth uncertainty and viewing angle favor the near, front-facing view over the oblique one.

    The choice between the two families is not stylistic. Geometric fusion needs metric extrinsics, reasonable depth, and a rigid rig, and in exchange it gives a metrically consistent scene where 3D detection, tracking, and occupancy prediction are natural. Token-level fusion needs almost nothing beyond a camera index, survives loose or drifting calibration, and keeps the full appearance detail that a projection into a coarse BEV grid throws away, which matters for open-ended questions such as reading a sign visible in only one view. Most deployed stacks are hybrid: encode per view, warp features to a common timebase, lift to a shared 3D representation for the geometric heads, and pass a reduced token set of the same features into the language decoder for reasoning.

    Top-to-bottom architecture diagram: three asynchronous camera feeds with different capture timestamps feed a shared ViT encoder with per-frame token reduction, which then branches into two fusion routes, token-level concatenation with camera-ID and pose embeddings on the left and geometric lifting into a shared BEV grid on the right, both feeding a vision-language decoder that emits text output

    Figure 1: The pipeline is shared up to the fusion point: timestamped feeds → weight-tied ViT → token reduction, then either Route A (concatenate all tokens and let attention resolve the overlap) or Route B (project a 3D grid into every camera and merge with weights). Route A pays in context length, Route B pays in calibration and depth accuracy.

    Mathematical Formulation:
    L_{vis} = N \cdot T \cdot P = 6 \cdot 8 \cdot 256 = 12288
    \hat{X}_c = T_{c \leftarrow e}\, \Delta T(t_q, t_c)\, X_p
    u_c = \pi(K_c\, \hat{X}_c)
    B(p) = \frac{\sum_c m_c w_c\, F_c(u_c)}{\epsilon + \sum_c m_c w_c}
    \Delta d = v\, |t_c - t_q|
    \Delta d = 16.7 \cdot 0.025 = 0.42\ \text{m}

    Where:

    • L_{vis} is the visual token count entering the decoder, with N cameras, T frames kept per camera, and P tokens per frame after reduction.
    • X_p is a 3D query point in the ego frame (a BEV cell center or a learned object query) and \hat{X}_c is the same point expressed in camera c‘s frame at that camera’s own capture time.
    • T_{c \leftarrow e} is the fixed extrinsic from ego to camera c, and \Delta T(t_q, t_c) is the ego-motion transform from the query time to the capture time, obtained from wheel odometry, IMU, or visual odometry.
    • K_c is the intrinsic matrix, \pi the perspective projection, u_c the resulting pixel location, and F_c(u_c) the encoder feature sampled there by bilinear interpolation.
    • m_c \in \{0,1\} is the visibility mask (point inside the frustum and unoccluded), w_c the per-camera confidence weight from depth uncertainty and incidence angle, and \epsilon a guard so uncovered cells stay zero instead of dividing by zero.
    • v is ego speed and |t_c - t_q| the timestamp offset, so \Delta d is the spatial error incurred by ignoring compensation; the numeric line uses v = 16.7 m/s (60 km/h) and a 25 ms offset expressed in seconds.
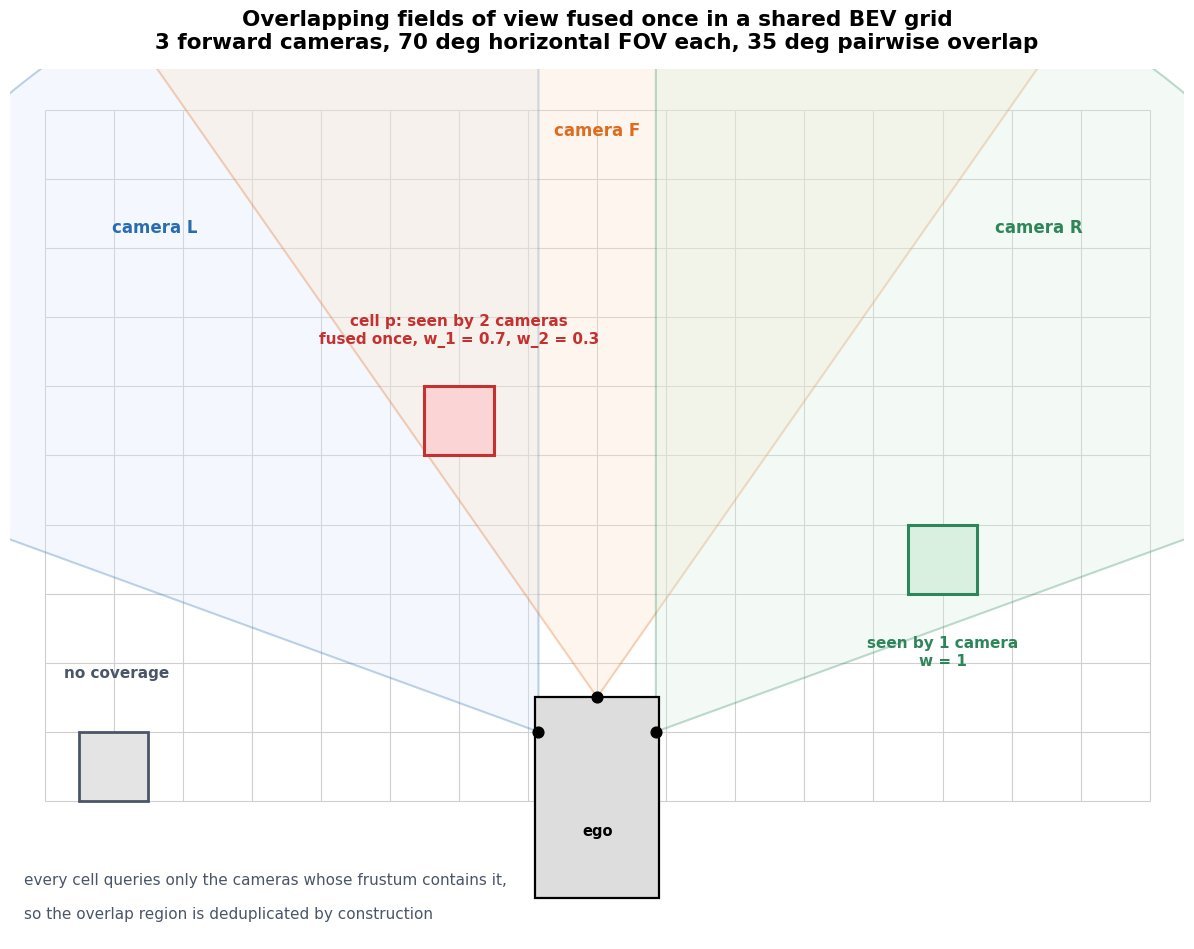
    Top-down BEV diagram of an ego vehicle with three forward camera frustums drawn as shaded wedges that overlap pairwise, laid over a square BEV grid; one highlighted cell falls inside two wedges and is labeled as fused with two weights, another cell falls inside one wedge only, and a cell at the far left falls outside all wedges and is labeled as having no coverage

    Figure 2: Why geometric fusion handles overlap cleanly. Each BEV cell queries every camera whose frustum contains it, so a cell in the pairwise overlap receives two samples that are averaged with confidence weights instead of appearing as two separate objects. Cells outside every frustum stay explicitly empty, which token-level concatenation cannot represent.

    Asynchrony bites hardest at the selection step. With free-running 30 fps sensors, the newest available frame from each camera can be up to one full period old, so a naive “latest frame per camera” gather can mix captures spread across 33 ms. At 60 km/h the rig moves 0.55 m in that window, which is larger than the BEV cell size most stacks use, and the symptom is a smeared or duplicated object in the overlap region rather than an obvious crash. Two fixes are standard: warp features per view with \Delta T(t_q, t_c) before sampling, and feed the residual offset to the model as a timestamp embedding so it can learn how much to trust a stale view. Hardware-triggered synchronous shutters remove the problem at the source and are worth the wiring cost on any rig that must produce metric output.

    Left panel: timeline of four free-running 30 fps camera feeds with staggered capture phases, showing the newest frame available before a query time of 40 milliseconds for each camera and a double-headed arrow marking a 25 millisecond spread. Right panel: line chart of ego displacement in meters versus timestamp offset from 0 to 50 milliseconds for speeds of 10, 30, 60 and 100 kilometres per hour, with a dotted horizontal line at a 0.3 metre fusion tolerance

    Figure 3: Free-running feeds mean the frames you gather at t_q can span nearly a full frame period (left), and that spread converts directly into ego displacement (right). At highway speed even a 20 ms offset exceeds a typical 0.3 m fusion tolerance, which is why the ego-motion warp is not optional.

    PropertyToken-level concatenationDense BEV liftingSparse 3D queries
    Shared representationThe LLM context itself, with camera-ID, pose and time embeddingsA metric BEV or voxel grid in the ego frameA few hundred learned 3D queries with reference points
    Overlap handlingImplicit; attention must learn that two tokens are one objectExplicit; one cell averages all cameras that see itExplicit; one query attends to all views that contain its point
    Asynchrony handlingTimestamp embedding only; residual error stays in the featuresEgo-motion warp per view before samplingQuery propagation across frames with a motion-compensated pose
    Calibration requirementLow; a camera index and rough pose are enoughHigh; extrinsic drift of a degree visibly smears the gridHigh for the projection, but errors stay local to each query
    Cost scalingQuadratic in N x T x P through self-attentionLinear in cameras, but grid resolution cubed in 3DLinear in queries times cameras, cheapest at high N
    Best forOpen-ended VQA, captioning, uncalibrated or ad hoc rigsOccupancy, map and free-space prediction on a rigid rigStreaming 3D detection and tracking under a latency budget

    Login to view more content
  • DL0138 Point-Informed Region VLM

    Explain how Point-Informed or Region-Based Vision-Language Models incorporate bounding boxes or visual prompts directly into self-attention, as in Ferret and Molmo.

    Answer

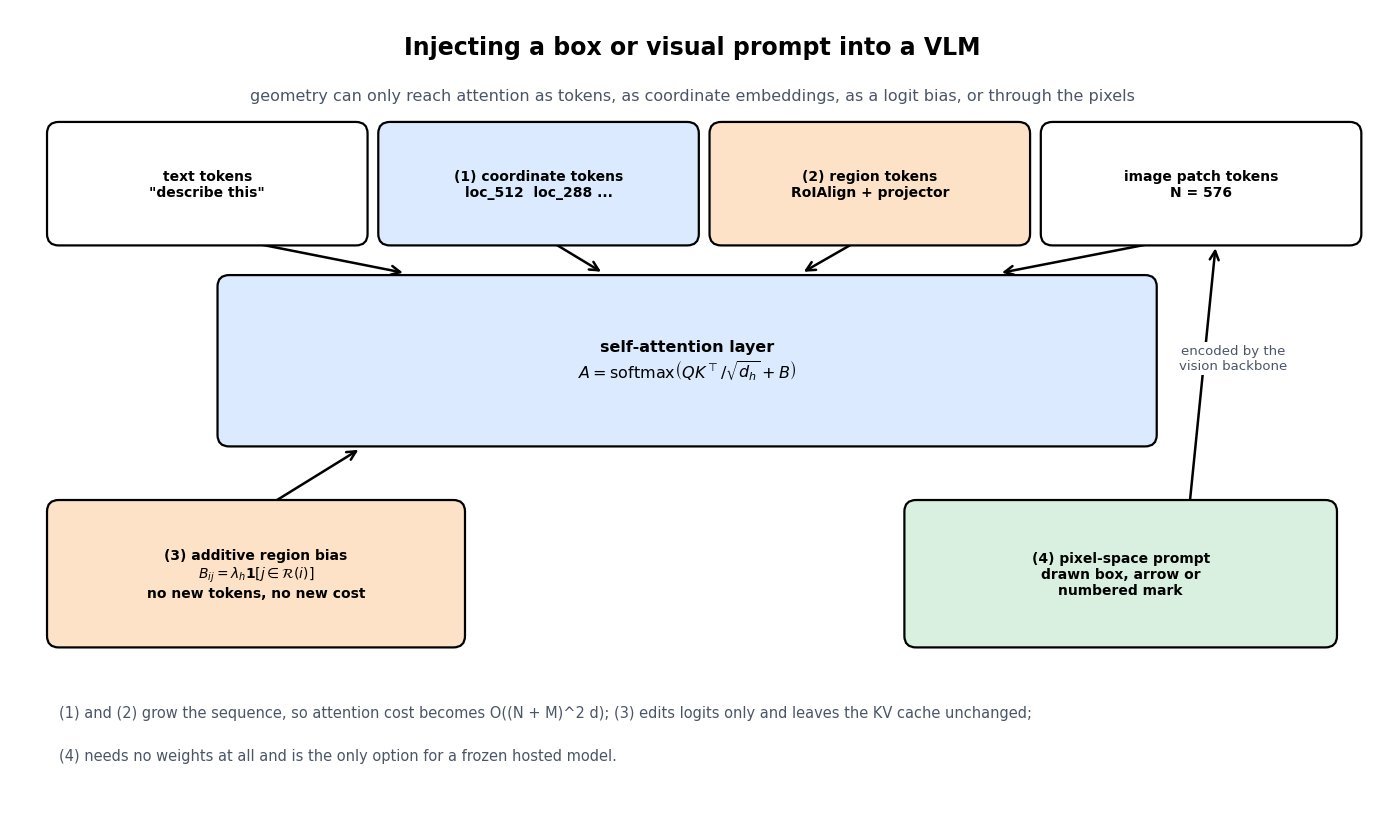
    A region-based VLM has to turn a geometric object (a box, a point, a scribble) into something a transformer can consume, and there are only three places to put it: the token sequence, the positional encoding, or the attention logits. The cheapest route serializes the geometry as coordinate tokens, either quantized bins added to the vocabulary (Kosmos-2 uses 1024 location tokens over a 32×32 grid, written like <loc_0512>) or plain digit strings (Shikra), so the box reaches self-attention as ordinary keys and values with zero architecture change. The second route extracts region features with RoIAlign or a learned sampler and projects them into the language model’s embedding space as extra tokens interleaved into the prompt (GPT4RoI, Ferret), which every text token can attend to like a word. The third route never adds tokens at all: it adds a bias matrix B to QK^{\top} before the softmax, so patches inside the referred region get a boost and patches outside get suppressed or hard-masked to -\infty. A fourth, architecture-free trick draws the prompt in pixel space (ViP-LLaVA’s overlaid arrows and circles, Set-of-Mark’s numbered masks) and lets the vision encoder’s own self-attention pick it up, which is the only option when the model is a frozen API. The choice is a trade among spatial precision, sequence growth, and how much grounding supervision you can afford to train on.

    (1) Three Injection Points: geometry enters as tokens, as positional/coordinate embeddings, or as an additive term inside the attention logits, and most systems combine at least two.
    (2) Coordinate Tokens Are Free But Quantized: a 1000-bin normalized grid on a 1024 px image gives roughly 1 px resolution, but the same bins on a 4K crop after tiling lose fidelity and shift under aspect-ratio padding.
    (3) Region Tokens Buy Content, Not Just Location: a pooled RoIAlign vector carries appearance of the referent, so the model can describe a region it could not have isolated from coordinates alone.
    (4) Attention Bias Adds Zero Parameters: B_{ij} is added elementwise to the pre-softmax scores, leaving the O(N^2 d) cost and the KV cache unchanged, and a per-head \lambda_h can be learned.
    (5) Hard Masks Destroy Context: setting B_{ij} = -\infty outside the region removes exactly the surrounding evidence that relational questions need, and a fully masked row produces a degenerate softmax.
    (6) Points Are Cheaper Supervision Than Boxes: Molmo’s pointing data shows a single (x, y) pair is enough for counting and referring, and it avoids the box-regression ambiguity for deformable objects.
    (7) Pixel-Space Prompts Work On Frozen Models: drawing the mark changes the image, not the architecture, but it occludes content and fails on thin or tiny structures.

    Diagram of a vision-language model token sequence containing text tokens, quantized coordinate tokens, projected region-feature tokens and image patch tokens, all feeding a self-attention block whose pre-softmax logits receive an additive region bias matrix from the side, with a separate pixel-space visual prompt path feeding the patch tokens

    Figure 1: Four ways a box reaches attention. Mechanisms (1) and (2) extend the token sequence so geometry becomes ordinary keys and values, mechanism (3) leaves the sequence untouched and edits the pre-softmax logits, and mechanism (4) modifies the pixels so the vision encoder does the work. Only (3) avoids sequence growth entirely.

    The region-feature path is the one that most resembles classical detection heads: pool the backbone feature map over the box (RoIAlign → linear projector → language-model token), then concatenate a coordinate embedding so the model knows where the appearance came from, not only what it looks like. Ferret generalizes this with a spatial-aware visual sampler that samples and pools features inside an arbitrary free-form shape, so a point, a box, and a scribble all reduce to the same fixed-size token, and Groma pushes localization into the tokenizer itself by proposing regions up front and giving each one a referable ID token. The attention-bias path is complementary and is the literal reading of the question: because the softmax is invariant to nothing but its own inputs, a single additive term reweights how much probability mass a text query spends on patches inside versus outside the referent, and a moderate \lambda_h concentrates mass without deleting surrounding context. In practice, training matters more than the plumbing: none of these mechanisms produces reliable grounding without a large corpus of region-text pairs, which is why grounded VLMs are trained on visual genome, RefCOCO-style referring expressions, and synthetically generated region captions.

    Mathematical Formulation:
    e_r = W_v\, \mathrm{RoIAlign}(F, b) + W_c\, \psi(b)
    \psi(b) = [\, x_1,\, y_1,\, x_2,\, y_2 \,] / S
    Z^{(0)} = [\, E_{txt};\; e_r;\; E_{img} \,]
    A = \mathrm{softmax}\!\left( \frac{QK^{\top}}{\sqrt{d_h}} + B \right)
    B_{ij} = \lambda_h \, \mathbf{1}[\, j \in \mathcal{R}(i) \,]
    \mathrm{cost} = O\big( (N + M)^2 d \big)

    Where:

    • e_r is the region token appended to the prompt, and Z^{(0)} is the full input sequence of text, region, and image-patch embeddings.
    • F is the vision-encoder feature map, b = (x_1, y_1, x_2, y_2) the box in pixels, S the image side used for normalization, and \psi(b) the normalized coordinate vector.
    • W_v projects the pooled region feature into the language-model width and W_c embeds the coordinates; both are the only new parameters this path needs.
    • Q, K are the query and key projections of Z, d_h the per-head dimension, and A the attention matrix over all N + M positions.
    • B is the additive region bias, \mathcal{R}(i) the set of positions that query i is encouraged to attend to (the patches overlapping the referred box), and \lambda_h \geq 0 the per-head bias strength; \lambda_h = 0 recovers plain attention and \lambda_h \to \infty gives a hard mask.
    • N is the number of visual plus text tokens, M the number of added region or coordinate tokens, and d the model width, so token-based injection is quadratic in M while the bias term is free.
    Three grayscale heatmaps of a text query's attention over an eight by eight patch grid, with a blue rectangle marking the referred region: the first with no bias shows diffuse mass spread across the image, the second with a soft additive bias concentrates mass inside the rectangle while keeping some outside, and the third with hard masking puts all mass inside the rectangle and exactly zero outside

    Figure 2: The same query, the same keys, three values of \lambda_h. A soft bias raises in-region mass from a small baseline to the majority while preserving outside context, which is what relational questions need; hard masking reaches 100% in-region mass and throws that context away.

    PropertyCoordinate tokensRegion-feature tokensAttention bias / maskPixel-space prompt
    Path into attentionNew vocabulary or digit tokens as keys/valuesPooled RoI feature projected to an embeddingAdded to pre-softmax logitsAltered patch embeddings
    New parametersEmbedding rows onlySampler plus two projectionsNone, or one scalar per headNone
    Sequence growth4 to 8 tokens per box1 to 49 tokens per regionZeroZero
    Precision limitBin width and tiling frameRoIAlign grid and patch stridePatch stride (14 or 16 px)Stroke width and image resolution
    Main failure modeCoordinate frame drift after padding or cropsToken blowup with many regionsLoses outside context; needs a region per queryOccludes the referent; fails on small objects
    Representative systemsPix2Seq, Kosmos-2, Shikra, Qwen2.5-VLGPT4RoI, Ferret, GromaRegion-conditioned decoders, SAM-style promptingViP-LLaVA, Set-of-Mark

    Login to view more content
  • DL0137 Early vs Late Fusion Multimodal

    Compare Early Fusion vs. Late Fusion in multimodal models. What are the scaling limitations of early fusion architectures when scaling parameters past 100B?

    Answer

    The two designs differ in where the modalities meet. Late fusion (the modular VLM recipe behind BLIP-2, LLaVA, and Qwen2-VL) keeps a separately pretrained vision encoder, compresses its output through a small connector (an MLP projector, a Q-Former, or gated cross-attention), and feeds the resulting soft tokens into a pretrained text LLM, so nearly all capacity is inherited and only the connector plus a light fine-tune is trained. Early fusion (native multimodal, as in Fuyu-8B, Chameleon, and Llama 4) discretizes or linearly projects raw patches into the same token stream as text and runs one shared transformer from layer 0, so every layer attends across modalities and the model can emit image tokens as well as text. Early fusion is representationally stronger and, per recent scaling-law work, not worse per FLOP, so its problems past 100B parameters are systems and data problems rather than a representational ceiling. You cannot reuse a trained text-only 100B checkpoint, a Chinchilla-scale run now wants roughly 2T interleaved tokens that do not exist at text quality, the shared dense weights must be split between modalities, and every image inflates the sequence that attention pays O(T^2) for.

    (1) Meeting Point Defines The Family: late fusion joins modalities after a frozen encoder has already compressed the image; early fusion joins them at the token level, before any transformer layer.
    (2) Checkpoint Reuse Is The Real Asymmetry: late fusion amortizes the trillions of text tokens already spent on the LLM, while a native 100B model pays that bill again on scarcer interleaved data.
    (3) Modality Competition In Shared Weights: a dense early-fusion stack allocates the same parameters to pixels and text, so raising the image-token fraction r costs text-benchmark quality and turns r into a hyperparameter you cannot sweep cheaply at 100B.
    (4) Token Budget Dominates The Context: one 512px image is about 1024 VQ tokens, so a four-image document spends 4096 tokens on pixels and quadratic attention absorbs the difference.
    (5) Optimization Instability Grows With Width: heterogeneous token statistics drive logit growth and loss spikes, which is why Chameleon needed QK-Norm, reordered normalization, and dropout to keep a 34B run stable.
    (6) Modularity Versus Capability: late fusion lets you swap the encoder or raise resolution for the price of a connector re-train, while early fusion buys interleaved any-to-any generation that a frozen tower cannot express.

    Two-panel architecture diagram: the left panel shows late fusion where an image passes through a frozen ViT encoder and a trainable projector before entering a pretrained 100B LLM alongside text tokens; the right panel shows early fusion where image patches and text are tokenized into a single interleaved stream that a shared transformer trained from scratch consumes

    Figure 1: Late fusion (left) is an assembly of pretrained parts, so the trainable surface is a projector of roughly 0.02B parameters and the alignment budget is on the order of 1B image-text tokens. Early fusion (right) is one homogeneous stack from random init, which is simpler to shard but means the whole 100B must be pretrained on interleaved data.

    The scaling wall past 100B is mostly arithmetic. A dense 100B model trained compute-optimally wants about 2T tokens and roughly 1.2 \times 10^{24} FLOPs, and in native early fusion those tokens must be interleaved image-text documents; the supply of such data at web-text quality is far smaller than the text corpus, so teams either repeat data or dilute the text share and watch reasoning benchmarks regress. Late fusion sidesteps this entirely because the expensive part is already paid: aligning a connector on a couple of billion tokens with a frozen backbone is three orders of magnitude cheaper than a from-scratch native run at the same parameter count. On top of the data problem, dense early fusion suffers capacity contention, since gradients from visual reconstruction and from language modeling compete for the same MLP weights, and sparsity is the standard fix: a mixture-of-experts stack with modality-aware routing gives each modality its own parameters while keeping active FLOPs fixed, which is why recent native models are almost always sparse. Early fusion does win on the systems side (no separate vision tower to shard, no encoder-LLM pipeline bubble, and a single tokenizer path), and it is the only option when the target task requires interleaved generation or genuinely fine-grained grounding that a pooled 576-token projection has already destroyed.

    Mathematical Formulation:
    h_v = W_p\, E_v(I)
    y = \mathrm{LLM}_{\phi}([\,h_v;\, E_t(x)\,])
    y = T_{\theta}([\,z_1, z_2, \ldots, z_T\,])
    C \approx 6ND
    D \approx 20N
    N = 10^{11} \Rightarrow C \approx 1.2 \times 10^{24}
    T = N_{img} + N_{txt}
    C_{attn} = \Theta(L\, T^{2}\, d)
    D_{txt} = (1 - r)\, D

    Where:

    • y is the generated output; the first two equations are the late-fusion path and the third is the early-fusion path, where a single stack T_{\theta} consumes the whole interleaved sequence.
    • I is the image and x the text; E_v is the pretrained vision encoder, E_t the text embedding, and W_p the connector, typically the only trained matrix during alignment.
    • z_t for t \in \{1,\ldots,T\} are the interleaved tokens, either VQ image codes or linear patch projections placed in the same sequence as text tokens.
    • N is the parameter count, D the training tokens, and C the training FLOPs; D \approx 20N is the Chinchilla compute-optimal ratio, which for N = 10^{11} demands about 2T tokens.
    • L is the layer count and d the model width, so C_{attn} shows that image tokens entering the shared stack are charged quadratically, not linearly.
    • r \in [0,1] is the image-token fraction of the pretraining mixture, so D_{txt} is the surviving text budget; at fixed C, every point of r is taken directly out of language modeling.
    Two-panel chart: left panel is a log-log plot of training FLOPs versus parameter count comparing native early fusion trained from scratch at 120 N squared against late-fusion connector alignment at four N times two billion tokens, with the gap at one hundred billion parameters annotated; right panel is a log-scale bar chart of image tokens per image for pooled projectors, SigLIP 384, Chameleon VQ, Qwen2-VL dynamic resolution, and native 1024 pixel patches

    Figure 2: Left: from-scratch native training scales as 120N^{2} under the compute-optimal token rule, while connector alignment scales linearly in N, so the gap at 100B is roughly three orders of magnitude. Right: the number of tokens an image consumes spans about an order of magnitude across tokenizers, and in early fusion every one of those tokens enters the shared quadratic attention rather than being pooled away first.

    PropertyEarly fusion (native)Late fusion (modular)
    Fusion pointToken level, before layer 1; all layers are cross-modalAfter a pretrained encoder, via a projector or cross-attention
    Trainable surfaceEvery parameter, from random initConnector plus optional LLM fine-tune; encoder often frozen
    Data requirement at 100BAbout 2T interleaved tokens, a corpus that barely exists at text qualityOrder 1B to 10B image-text pairs plus instruction data
    Dominant failure modeModality competition for dense capacity, text regression, loss spikesInformation already discarded by the frozen encoder (OCR, small objects, counting)
    Upgrade pathResolution or tokenizer changes touch the pretraining recipeSwap the encoder or the LLM and re-align the connector
    Generation abilityInterleaved any-to-any output, since image tokens are in the vocabularyText out only, unless a separate image decoder is bolted on
    Representative systemsFuyu-8B, Chameleon, Transfusion, Llama 4Flamingo, BLIP-2, LLaVA-1.5, Qwen2-VL, InternVL

    Login to view more content
  • DL0136 Unified Multimodal Gemini Architecture

    How do unified multi-modal models such as Google’s Gemini handle simultaneous natively tokenized audio, vision, and text input streams?

    Answer

    A unified model does not bolt encoders onto a finished language model at inference time; it is pretrained from step zero on interleaved sequences in which every modality has already been converted into tokens that live in the same d-dimensional embedding space. Text passes through a SentencePiece vocabulary, images and sampled video frames through a ViT-style patch encoder, and audio through a speech encoder in the Universal Speech Model (USM) lineage operating on 16 kHz waveforms; each front end emits discrete ids or continuous soft tokens that are projected to the model width and concatenated in timestamp order into one causal sequence. From that point there is no separate fusion module: ordinary self-attention in every layer is the fusion mechanism, so a text token attends to an audio window from second 12 and to the patch tokens of the frame shown during that second at the same cost as attending to another word. The consequences of native tokenization are therefore budgetary rather than architectural, because Gemini’s published token rates are roughly 258 tokens per image tile or sampled frame and 32 tokens per second of audio, so one hour of video with its soundtrack consumes about 1M tokens and long context stops being a feature and becomes a precondition.

    (1) Native Tokenization, Not An Adapter: multimodal data is present in pretraining from the first step, so the shared representation is learned jointly rather than stitched together by a projector trained on top of two frozen towers.
    (2) One Shared Embedding Space: a per-modality encoder plus a linear projection maps sub-words, patches, and audio frames into the same \mathbb{R}^{d}, which is what makes concatenation legal.
    (3) Self-Attention Does The Cross-Modal Work: there is no cross-attention adapter per modality, and the price is a O(L^2 d) prefill over the combined length.
    (4) Timestamp-Ordered Packing: tokens from the same second of an audio-visual clip are placed adjacent, so co-occurring events are a few hundred positions apart instead of hundreds of thousands.
    (5) Token Rates Set The Budget: 258 tokens per frame, 32 tokens per audio second, and 1 fps frame sampling as the lossy compression knob that decides what the model can even see.
    (6) The Output Side Can Be Multimodal Too: a single next-token head over a vocabulary extended with discrete image and audio codec tokens lets one decoder emit text, pixels, or speech without a separate generator.

    Architecture diagram with three input lanes for text, image or video, and audio, each passing through its own tokenizer or encoder and a linear projection into a shared d-dimensional space, then merging into one interleaved token sequence in timestamp order that feeds a single decoder-only transformer with full self-attention, which emits text tokens, discrete image tokens, and audio codec tokens

    Figure 1: Three front ends, one sequence, one stack. The only modality-specific parameters sit in the encoders and projections; after that the tokens are indistinguishable to the transformer, and the output modality is decided purely by which token ids the single next-token head emits.

    Two design decisions do most of the work. The first is early fusion: because all three streams enter the same stack as tokens, cross-modal alignment is learned by the same attention weights that learn syntax, which is what lets the model join a spoken sentence to whatever was on screen while it was said. A late-fusion alternative, where a frozen vision tower is glued to a frozen LLM through a projector or Flamingo-style cross-attention adapter, is far cheaper to train but confines modality interaction to the adapter, while a cascade (audio → ASR → LLM → TTS) discards everything the transcript does not carry, including speaker identity, prosody, laughter, and overlapping non-speech events. The second decision is packing order. Placing the frame tokens and the audio tokens of the same second next to each other keeps relative position encodings informative and keeps local attention patterns useful, whereas a modality-blocked layout pushes a frame and its own soundtrack thousands of positions apart. Frame rate is then the compression knob: 1 fps is adequate for scene-level questions but structurally unable to represent a 200 ms gesture, a single flashed frame, or the exact moment a door closes.

    Two token-sequence strips compared: the top strip alternates a wide block of 258 image tokens with a thin slice of 32 audio tokens for each of four consecutive seconds in timestamp order, and the bottom strip places all four image blocks first followed by all four audio slices, with a double-headed arrow showing that frame zero and its own audio are now 1032 tokens apart

    Figure 2: The same tokens, two layouts. Time-interleaved packing keeps each frame beside the 32 audio tokens recorded during it, while modality-blocked packing separates them by 1,032 positions, which is why audio-visual grounding degrades even though attention can technically still reach across the whole sequence. The width ratio also shows the real cost structure: vision dominates the budget roughly 8 to 1 over audio.

    Mathematical Formulation:
    u_i = W_m \phi_m(x_i)
    S = (u_1, u_2, \ldots, u_L)
    L = L_{\mathrm{txt}} + 258 N_f + 32 T_a
    \mathrm{prefill} = O(L^2 d)
    p(y_{1:M}) = \prod_{j=1}^{M} p(y_j \mid S, y_{1:j-1})

    Where:

    • u_i \in \mathbb{R}^{d} is the i-th token embedding in the shared space and x_i the raw unit behind it (a sub-word, an image tile, or a short audio window).
    • \phi_m is the front end for modality m \in \{\mathrm{txt}, \mathrm{img}, \mathrm{aud}\} and W_m its projection to the model width d; text is an embedding lookup over discrete ids, vision and audio produce continuous soft tokens.
    • S is the single causal sequence, ordered by timestamp rather than by modality, and L is its length.
    • L_{\mathrm{txt}} is the text token count, N_f the number of image tiles or sampled frames at 258 tokens each, and T_a the audio duration in seconds at 32 tokens each.
    • The prefill term is quadratic in L while the KV cache grows linearly, so audio and video inflate both compute and memory before a single output token is produced.
    • y_{1:M} is the generated output drawn from one next-token distribution whose vocabulary may include discrete image and audio codes alongside sub-words.

    Token Budget For One Hour Of Video With Sound:
    3600 \times 258 = 928800
    3600 \times 32 = 115200
    L = 928800 + 115200 = 1044000

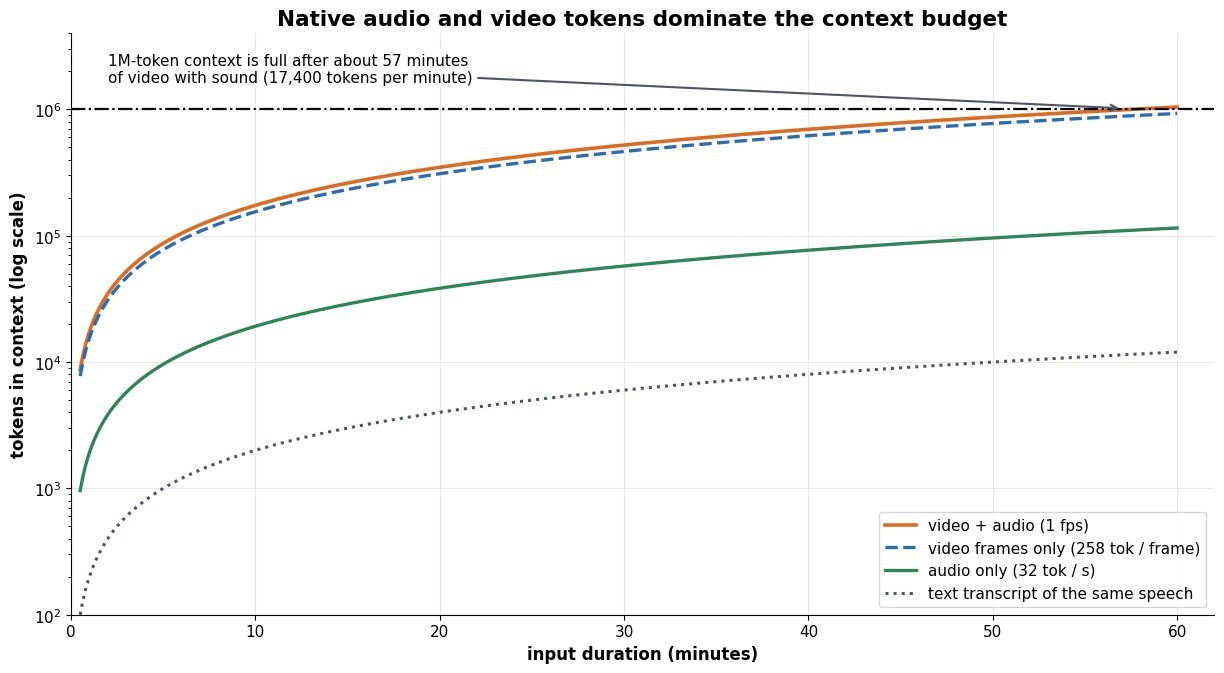
    A single hour of ordinary video therefore saturates a 1M-token window, which explains why native multimodality and million-token context arrived together in Gemini 1.5 rather than as separate features. It also explains where production effort actually goes: not into inventing a fusion block, but into deciding frame rate, tile count, and audio span so that the useful evidence survives tokenization, and into paying the quadratic prefill only for the segments that matter.

    Log-scale line chart of tokens consumed versus input duration in minutes for four streams: a text transcript at about 200 tokens per minute, audio only at 1920 tokens per minute, video frames only at 15480 tokens per minute, and video plus audio at 17400 tokens per minute, with a dashed horizontal line marking a one-million-token context that the video plus audio curve reaches at about 57 minutes

    Figure 3: Native tokens are not cheap. At published rates, a spoken transcript costs about 200 tokens per minute while the same minute of video plus audio costs roughly 17,400, so the entire 1M-token context is spent after about 57 minutes. Every design choice about frame rate, tiling, or clip trimming is a move along this line.

    PropertyTextVision (image / video)Audio
    Front endSentencePiece sub-word vocabulary, discrete idsViT-style patch encoder emitting continuous soft tokensSpeech encoder in the USM lineage over 16 kHz audio
    Token rateAbout 1 token per 4 charactersAbout 258 tokens per tile, and per sampled frame at 1 fps32 tokens per second, independent of content
    Temporal handlingSequence order only, no clockFrames sampled at a fixed rate and packed in timestamp orderContinuous, packed beside the frames of the same second
    Native generationStandard next-token softmaxDiscrete image tokens in Gemini 2.0 native image outputCodec tokens in the native-audio and Live streaming models
    Dominant failure modeTokenizer fragments rare words, digits, and code1 fps sampling misses sub-second events, and tiling explodes the budgetCoarse rate blurs fine prosody, and long clips crowd out the prompt

    Login to view more content
  • DL0135 Dynamic High-Resolution ViT

    How do Dynamic High-Resolution ViT slicing architectures handle non-standard aspect ratios and high-resolution images without spatial distortion?

    Answer

    A pretrained vision tower expects one fixed square input, usually 336 \times 336 or 448 \times 448, with exactly one learned position embedding per patch. Squashing a 1500 \times 500 receipt or slide into that square applies anisotropic scaling (0.30x horizontally against 0.90x vertically), which shears glyphs and bar charts before the encoder sees a single pixel, while interpolating the position-embedding grid up to native resolution is both off-distribution and quadratically expensive in attention. Dynamic high-resolution slicing, the AnyRes family used by LLaVA-NeXT, UReader, Monkey, MiniCPM-V and InternVL 1.5, avoids both by never changing the encoder’s input size: it picks a tile grid whose aspect ratio best matches the image, resizes the image to exactly n_w S \times n_h S, cuts it into n_h n_w native-resolution tiles that are encoded independently, and appends a downsampled full-image thumbnail to restore the global layout that slicing destroys. Because the target width and height are both integer multiples of the same tile size chosen to match the input ratio, the horizontal and vertical scale factors are (nearly) equal, so the resize is isotropic and no geometry is distorted. What remains is a budgeting problem: the token count grows linearly in tiles, so token compression and a cap N_{\max} on the tile product decide how much resolution you can actually afford.

    (1) Aspect-Ratio Matched Grid: enumerate all grids with n_h n_w \leq N_{\max} and pick the one minimizing the log-ratio mismatch against W/H, which is exactly the quantity that becomes anisotropic shear if you get it wrong.
    (2) Tiles Stay At Native Resolution: every tile is precisely S \times S, so the frozen CLIP or SigLIP tower runs at its pretraining resolution with no position-embedding interpolation and no distribution shift.
    (3) Thumbnail Carries Global Context: tiles are encoded independently, so no attention crosses a seam; a low-resolution whole-image view is concatenated to supply page layout and object-scale cues.
    (4) Linear Instead Of Quadratic Attention: encoding K tiles of M patches costs K \cdot O(M^2) rather than O(K^2M^2) for one giant grid, a K-fold saving that is why slicing scales to 4K pages.
    (5) Token Compression Is Mandatory: a pixel-unshuffle of stride 2 folds each 2 \times 2 patch neighborhood into one embedding, cutting 1024 patches per 448 tile to 256 tokens; without it a 12-tile page costs over 13k tokens.
    (6) The LLM Must Be Told The Layout: the flattened tile sequence is ambiguous, so implementations insert row separator tokens or 2D tile indices, otherwise a 3 \times 1 and a 1 \times 3 arrangement look identical downstream.

    Two-panel diagram of a 1500 by 500 panoramic input containing a reference circle. The left panel resizes it into a single 448 by 448 square, where the circle becomes a narrow vertical ellipse because horizontal scale is 0.30x and vertical scale is 0.90x. The right panel matches a 3 by 1 tile grid, resizes to 1344 by 448 with both axes at 0.90x so the circle stays circular, cuts it into three native-resolution 448 tiles, and adds a low-resolution global thumbnail.

    Figure 1: The reference circle is the whole story. A single square resize applies different scale factors per axis, so the circle becomes an ellipse and every glyph shears; the aspect-ratio-matched grid scales both axes by 0.90x, keeps each tile at the encoder’s native 448 \times 448, and pays for the lost cross-tile view with one global thumbnail.

    Two details separate a correct implementation from a leaky one. First, the resize to n_w^\ast S \times n_h^\ast S is only exactly isotropic when the chosen grid ratio equals the image ratio; otherwise a residual anisotropy survives, equal to the log mismatch, and it is bounded by how fine your candidate set is. With N_{\max} = 6 a 4:3 photo still carries 0.29 of residual log-anisotropy because the exact 3 \times 4 grid needs 12 tiles, which is why InternVL 1.5 raises N_{\max} to 12 and InternLM-XComposer2-4KHD pushes to 55 tiles, and why some systems pad to the grid instead of stretching. Second, slicing changes what the encoder can see: a table row spanning a vertical seam is split across two independently encoded tiles, so the fusion must happen inside the language model rather than in the vision tower, and this is the main reason answers to fine-grained OCR questions degrade near tile boundaries. Token cost is the binding constraint in production: LLaVA-NeXT at S=336 with at most 4 tiles plus a base view spends 5 \times 576 = 2880 tokens per image, and InternVL 1.5 with 12 tiles plus a thumbnail spends 13 \times 256 = 3328 only because pixel shuffle compresses each tile fourfold.

    Mathematical Formulation:
    \mathcal{G} = \{(n_h, n_w) : n_h n_w \leq N_{\max}\}
    (n_h^\ast, n_w^\ast) = \arg\min_{\mathcal{G}} \left| \log \frac{n_w}{n_h} - \log \frac{W}{H} \right|
    s_x = \frac{n_w^\ast S}{W}
    s_y = \frac{n_h^\ast S}{H}
    D = \left| \log \frac{s_x}{s_y} \right|
    T = (n_h^\ast n_w^\ast + 1) \frac{S^2}{p^2 r^2}

    Where:

    • (n_h^\ast, n_w^\ast) is the selected tile grid, and \mathcal{G} the candidate set of grids whose tile product stays within the budget N_{\max}.
    • W and H are the original image width and height, and S is the encoder’s native side length (336 for LLaVA-NeXT, 448 for InternVL 1.5).
    • s_x and s_y are the per-axis scale factors of the resize, and D is the residual anisotropy: D = 0 means the resize is isotropic and geometry is preserved exactly.
    • T is the vision-token count fed to the LLM, with the +1 accounting for the global thumbnail.
    • p is the patch size (typically 14) and r the pixel-shuffle stride, so S=448, p=14, r=2 gives 1024/4 = 256 tokens per tile.
    • The objective is stated in log space because minimizing |\log(n_w/n_h) - \log(W/H)| is identical to minimizing D, which makes aspect matching and distortion control the same problem.
    Two charts. Left: residual log-anisotropy versus the maximum tile product for images of aspect ratio 4:3, 3:1, 5:1 and 8:1, showing step decreases to zero when an exactly matching grid enters the candidate set, with the 4:3 curve stuck at 0.29 until twelve tiles are allowed. Right: vision-token count versus tile count for pixel-shuffle stride 1 and stride 2, with a horizontal 4096-token image budget line that stride 1 crosses at three tiles while stride 2 stays under it through twelve tiles.

    Figure 2: The two knobs pull against each other. Raising N_{\max} is what drives residual anisotropy to zero for awkward ratios (left), but each extra tile buys a fixed block of tokens, so only pixel-shuffle compression keeps a 12-tile page inside a realistic per-image token budget (right).

    PropertySquare resize + PE interpolationDynamic tiling (AnyRes)Native dynamic resolution
    Aspect handlingAnisotropic stretch, or padding that wastes most of the input areaIsotropic up to grid quantization; residual anisotropy shrinks as N_max growsExact: the patch grid itself takes the image’s shape, no quantization
    Encoder reuseFrozen tower reused, but interpolated position embeddings go off-distributionFrozen tower reused unchanged at its exact pretraining resolutionRequires training or adapting the tower with 2D RoPE and variable-length packing
    Attention costQuadratic in total patches once resolution is raisedLinear in tiles: K independent O(M squared) passes, easy to batchQuadratic over the full image unless windowed or block-diagonal attention is used
    Global contextComplete but low detail; small text is unrecoverableBroken at seams; restored approximately by the thumbnail and separator tokensIntact, every patch can attend to every other patch in the image
    Representative systemsOriginal LLaVA, BLIP-2, early CLIP-based VLMsUReader, Monkey, LLaVA-NeXT, MiniCPM-V, InternVL 1.5 and 2.5NaViT, Idefics2, Qwen2-VL and Qwen2.5-VL, Pixtral

    Login to view more content
  • DL0134 Interleaved Vision-Language Architectures

    Explain Interleaved Vision-Language Architectures. How do models pre-trained on mixed sequences of raw image tokens and text tokens differ from cross-attention models?

    Answer

    An interleaved vision-language architecture flattens a document into one sequence that alternates text spans and images, projects each image’s patch features into the language model’s embedding space, and trains a single decoder with ordinary next-token prediction over the mixed stream. This is early fusion: visual tokens occupy real sequence positions, so they are keys and values for every text token in every layer, and text tokens are keys and values for the image. The alternative family, cross-attention conditioning (Flamingo, Idefics1), keeps vision outside the text sequence: a frozen ViT plus a Perceiver resampler compresses each image to a fixed R = 64 latents, and newly inserted gated cross-attention layers let the frozen LM read those latents without ever lengthening its own sequence. The consequences are structural rather than cosmetic. Early fusion makes cost quadratic in the joint length L = N_t + M N_v and demands full multimodal pre-training, but it gives uniform bidirectional-within-causal mixing, unlimited image ordering, and (with discrete VQ image tokens) the ability to generate images from the same head. Cross-attention decouples image count from the text sequence and protects a strong frozen LLM, at the price of a hand-designed conditioning path, per-image attention masks that weaken multi-image relational reasoning, and no route to image output.

    (1) Where Fusion Happens: early fusion concatenates projected patch embeddings into the token stream, so mixing occurs in every self-attention layer; cross-attention confines mixing to a handful of inserted layers reading a fixed latent set.
    (2) Sequence Length Is The Cost Model: a ViT-L/14 at 336 px yields N_v = 576 tokens per image, so eight images add 4608 positions and roughly 100\times the attention cost of a text-only forward pass.
    (3) Attention Pattern And Multi-Image Reasoning: Flamingo masks each text token to cross-attend only to the most recent preceding image, while early fusion lets any token attend to all earlier images and their surrounding text.
    (4) Parameter Budget And Text Regression: cross-attention adds new trainable blocks around a frozen LM and preserves text-only quality by construction; early fusion updates the whole backbone and risks catastrophic forgetting unless text data is replayed.
    (5) Generation Symmetry: only the interleaved token-in-sequence form can emit images, because image outputs must live in the same vocabulary the head predicts (Chameleon, Emu3).
    (6) Data Requirement: both families need interleaved web corpora such as M3W or OBELICS rather than caption pairs, since few-shot in-context learning is what interleaving buys.

    Two-panel architecture diagram: left panel shows interleaved early fusion where text token groups and 576-token image groups alternate in one row feeding a single causal self-attention stack and a joint-vocabulary next-token head; right panel shows cross-attention conditioning where an image passes through a frozen ViT and a Perceiver resampler producing 64 latents that are read by gated cross-attention layers inserted between frozen language model blocks

    Figure 1: The two conditioning paths. In early fusion the image becomes sequence positions inside the shared stack, so every layer mixes modalities and the sequence grows with each image. In cross-attention conditioning the image stays outside the text sequence as a fixed set of R latents, read through gated layers whose gate starts at zero so the frozen LM is initially unchanged.

    Practice has converged on early fusion, and the reason is mostly negative: the cross-attention path is an extra design surface with its own hyperparameters (how many layers to insert, resampler depth, latent count, gate schedule) and it caps the visual information at R latents regardless of image resolution, which destroys dense OCR and chart reading. Ablations in MM1 found the interleaved token-in-sequence recipe matched or beat cross-attention at equal scale while being simpler, and the lineage of the same lab’s open models makes the shift explicit: Idefics1 (Flamingo-style cross-attention) → Idefics2 (early fusion with pooled visual tokens). Early fusion then imports the cross-attention family’s one real advantage, token compression, without its plumbing: Idefics3 pixel-shuffles 2 \times 2 patch blocks into one token, Qwen2-VL merges adjacent patches in the projector, and both keep the compressed tokens in the main sequence. What remains genuinely hard in early fusion is positional encoding for a 2D object embedded in a 1D stream, handled by explicit row-separator tokens in Fuyu or by multimodal rotary embeddings that give an image token separate height, width, and time indices.

    Mathematical Formulation:
    N_v = (H/P)\,(W/P)
    L = N_t + M\,N_v
    C_{\mathrm{self}} = O(L^2 d)
    Z = \mathrm{Resampler}(\mathrm{ViT}(I)) \in \mathbb{R}^{R \times d}
    C_{\mathrm{cross}} = O(N_t\, M R\, d)
    y_\ell = h_\ell + \tanh(\alpha_\ell)\,\mathrm{XAttn}(h_\ell, Z)

    Where:

    • H, W are the image height and width and P the patch size, so N_v is the visual tokens per image: at 336/14 this is 24 \times 24 = 576.
    • N_t is the number of text tokens, M the number of images in the document, and L the joint sequence length the early-fusion decoder actually processes; d is the model width.
    • C_{\mathrm{self}} is the self-attention cost, quadratic in L, so each added image contributes both its own N_v^2 block and cross terms with all existing tokens.
    • I is the raw image, Z the resampled latents, and R \ll N_v the latent count (R = 64 in Flamingo), which is why C_{\mathrm{cross}} is linear in M and leaves the LM’s own O(N_t^2 d) untouched.
    • h_\ell are the frozen LM hidden states at layer \ell and \alpha_\ell a learned scalar gate initialized to zero, so \tanh(\alpha_\ell) = 0 makes the inserted block an identity at step 0 and training degrades the language model gradually rather than abruptly.
    Line chart of attention cost normalized to a text-only forward pass versus the number of images from one to eight, with three curves: early fusion at 576 tokens per image rising quadratically to about one hundred times, early fusion with four-times pooling at 144 tokens per image rising to about ten times, and cross-attention with 64 latents per image rising linearly to about two times

    Figure 2: Why token count dominates the choice. Early fusion pays O(L^2) in the joint sequence, so eight full-resolution images cost roughly 100\times a text-only pass, while cross-attention stays near 2\times because its cost is linear in M R. Patch pooling recovers most of the gap without leaving the sequence, which is the modern compromise.

    PropertyInterleaved early fusionCross-attention conditioning
    Image positionReal sequence positions inside the decoderOutside the sequence, as fixed keys and values
    Cost in image countQuadratic through the joint length LLinear, and only in the inserted layers
    Trainable surfaceProjector plus the whole backbone, usually full pre-trainingResampler and gated cross-attention only, LM frozen
    Visual detail ceilingScales with resolution; supports OCR and dense chartsCapped at R latents regardless of resolution
    Multi-image reasoningAll prior images visible to every tokenTypically masked to the most recent image per text token
    Image generationPossible with discrete VQ image tokens in one vocabularyNot possible; the path is input-only
    Representative modelsFuyu-8B, Chameleon, Idefics2/3, MM1, Qwen2-VL, Emu3Flamingo, OpenFlamingo, Idefics1, Llama 3.2 Vision

    Login to view more content
  • DL0133 VLM Fusion: Cross-Attention, Q-Former, and MLP

    Compare Cross-Attention fusion, Perceiver Resampler / Q-Former, and Linear/MLP Projection (e.g., LLaVA) for vision-language alignment.

    Answer

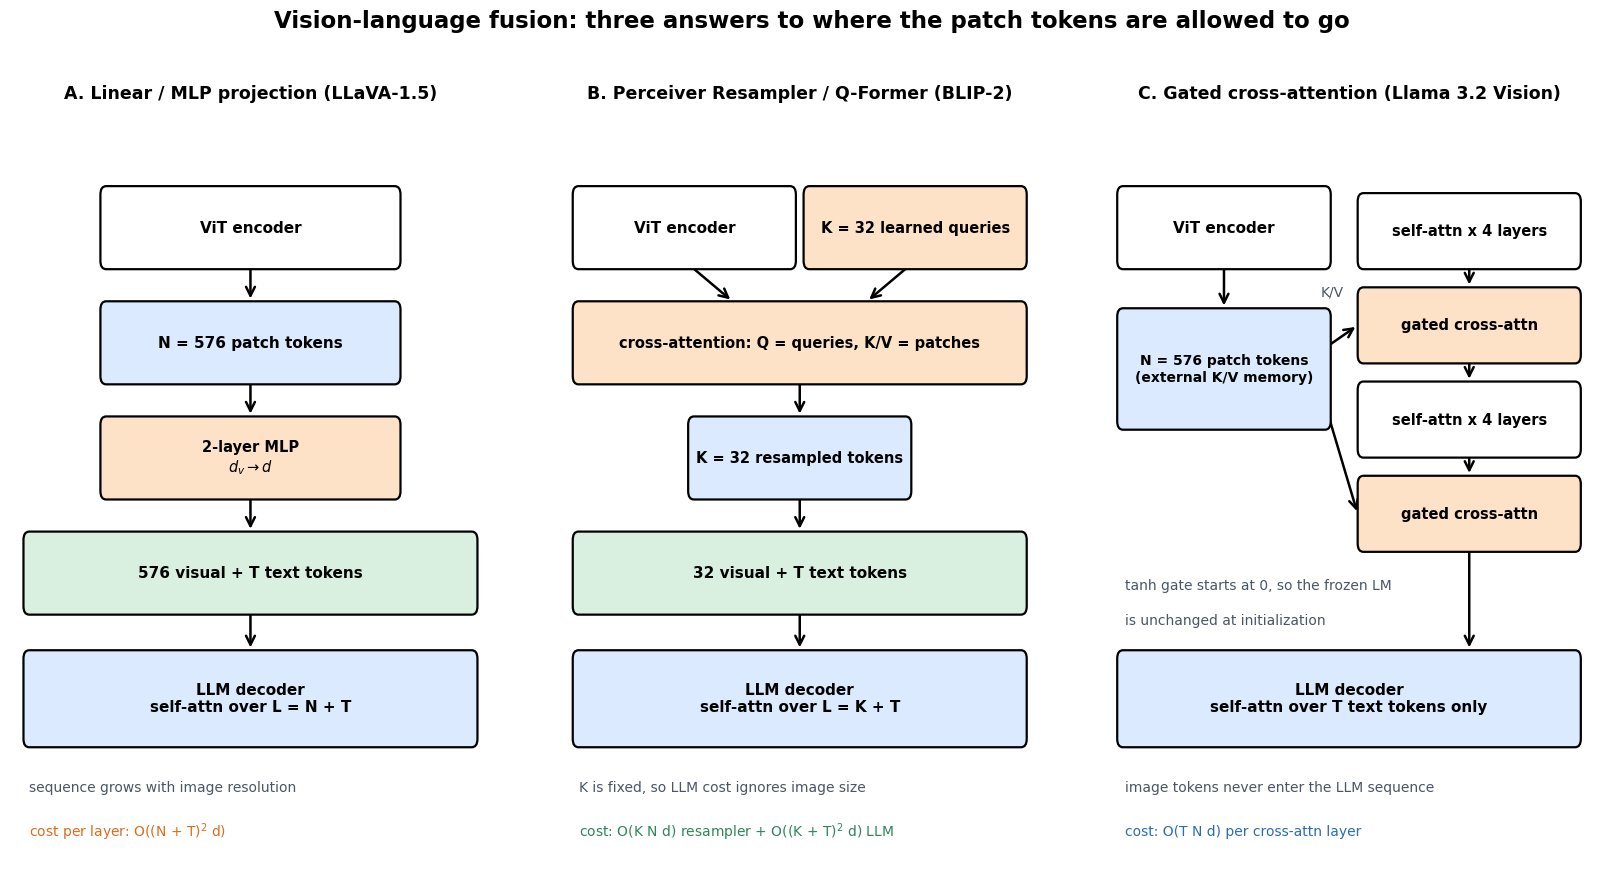
    All three designs answer one question: where does the frozen vision encoder’s patch grid meet the language model? Linear/MLP projection (LLaVA, LLaVA-1.5, Qwen2-VL, InternVL) maps every patch embedding into the LLM’s token space with a two-layer MLP and concatenates the result onto the text sequence, so vision and language share one self-attention stack. Perceiver Resampler / Q-Former (Flamingo, BLIP-2) inserts a small cross-attention module in which a fixed set of K learned queries (64 latents in Flamingo, 32 in BLIP-2) attends over the N patch tokens and emits exactly K vectors, decoupling the LLM’s sequence length from image resolution. Gated cross-attention fusion (Flamingo’s xattn-dense blocks, Llama 3’s vision adapter, NVLM-X) never puts image tokens in the LLM sequence at all: new cross-attention layers are interleaved into the language stack (every fourth layer in Llama 3) and read the patch tokens as an external key/value memory, with a tanh gate initialized to zero so the model starts out behaviorally identical to the text-only LLM. The trade-off is compute versus fidelity versus intrusiveness: MLP concatenation is the simplest and preserves the most visual detail but makes prefill grow as O((N+T)^2); resampling is cheapest and constant-cost but imposes a hard information bottleneck; cross-attention keeps text throughput almost untouched and protects a frozen LLM, at the price of new parameters and a more complex training recipe.

    (1) Where The Visual Tokens Live: MLP projection puts them inside the LLM sequence, a resampler puts a compressed K of them inside, and cross-attention keeps them outside as an external memory.
    (2) Prefill Cost Scaling: concatenation pays O((N+T)^2 d) per layer, a resampler pays O((K+T)^2 d) with K \ll N, and cross-attention pays O(T N d) only in the inserted layers.
    (3) Added Parameters: LLaVA-1.5’s connector is roughly 20M parameters of MLP, BLIP-2’s Q-Former is about 188M with a BERT-base initialization, and Llama 3’s cross-attention adapter adds tens of billions at the 405B scale.
    (4) Information Bottleneck: a fixed K caps how much of a high-resolution image can survive, which is why resampler-based models underperform on dense OCR, charts, and counting.
    (5) Frozen Versus Tuned Backbones: the Idefics2 ablation found cross-attention wins when the LLM is frozen, while the fully autoregressive concatenation design wins once the LLM is unfrozen.
    (6) Token Count Beats Connector Design: MM1’s ablations show the connector type matters far less than image resolution and visual token count, which is why the field converged on MLP plus cheap token compression.

    Three-panel architecture diagram. Panel A: ViT encoder produces 576 patch tokens, a two-layer MLP maps them into the LLM token space, and they are concatenated with T text tokens so self-attention runs over N plus T positions. Panel B: 32 learned queries cross-attend over the 576 patch tokens to produce 32 resampled tokens, which are concatenated with the text so self-attention runs over K plus T positions. Panel C: patch tokens stay outside the LLM as an external key value memory read by gated cross-attention layers inserted every fourth self-attention block, so self-attention still runs over T text tokens only.

    Figure 1: The three fusion families differ only in where the patch tokens are allowed to go. Concatenation admits all N of them into the shared sequence, a resampler admits a fixed K, and gated cross-attention admits none, reading them instead as an external memory through layers whose tanh gate starts at zero.

    The training recipe follows from the architecture. An MLP connector is so small that a two-stage schedule with about 558K caption pairs for alignment and 665K instruction samples for tuning is enough to reach state-of-the-art benchmark scores, which is what made LLaVA-1.5 reproducible on a single node. A Q-Former is a real transformer that must learn what to query, so BLIP-2 needs a dedicated representation-learning stage (contrastive, matching, and captioning objectives) before the generative stage, and remains the least data-efficient of the three per unit of final accuracy. Cross-attention sits in between: the gate makes optimization stable and lets you keep the language model frozen, so text benchmarks cannot regress, but you are training new layers that must learn to be useful without ever seeing visual tokens in the residual stream. NVLM’s controlled comparison is the cleanest evidence on the trade-off, finding the decoder-only concatenation variant stronger on OCR and multimodal reasoning while the cross-attention variant gave better throughput on high-resolution inputs.

    Mathematical Formulation:
    Z = E_v(I) \in \mathbb{R}^{N \times d_v}
    H_v = W_2\,\sigma(W_1 Z) \in \mathbb{R}^{N \times d}
    L = N + T
    R = \mathrm{Attn}(Q, Z, Z) \in \mathbb{R}^{K \times d}
    H_t \leftarrow H_t + \tanh(\alpha)\,\mathrm{Attn}(H_t, Z, Z)
    C_{\mathrm{self}} = O(L^2 d)
    C_{\mathrm{cross}} = O(T N d)

    Where:

    • I is the input image, E_v the vision encoder (typically a frozen CLIP or SigLIP ViT), and Z its patch token grid.
    • H_v is the projected visual sequence, with W_1, W_2 the connector weights and \sigma a GELU nonlinearity; a single W recovers the original linear projection of LLaVA-1.
    • N is the patch count (576 for ViT-L/14 at 336 px), T the text length, L the LLM sequence length, d the LLM width, and d_v the vision width.
    • Q \in \mathbb{R}^{K \times d} are the learned latent queries and R the resampled output; K is fixed at design time, so R has the same size for a thumbnail and for a 4K page.
    • H_t is the text hidden state inside the LLM and \alpha the scalar gate parameter, initialized so that \tanh(\alpha) = 0 and the pretrained language behavior is exactly preserved at step zero.
    • C_{\mathrm{self}} is the per-layer self-attention cost that concatenation inflates, and C_{\mathrm{cross}} the per-layer cost of a cross-attention block, which is linear in N rather than quadratic.
    Log-scale line chart of relative prefill attention cost versus number of visual tokens from zero to 2880, for a 512-token text prompt and a 32-layer language model. The MLP concatenation curve rises quadratically to about forty-four times the text-only baseline, the gated cross-attention curve rises linearly to about two point four times, and the 64-latent resampler curve stays nearly flat at about one point four times.

    Figure 2: Prefill attention cost relative to a text-only forward pass at T = 512. At 2880 visual tokens, concatenation costs about 44\times the text-only baseline because the whole stack pays O((N+T)^2), gated cross-attention costs about 2.4\times since only 8 of 32 layers see the image and they scale as O(TN), and a 64-latent resampler stays near 1.4\times because the LLM never sees more than K + T positions.

    PropertyLinear / MLP projectionPerceiver Resampler / Q-FormerGated cross-attention
    Tokens entering the LLM sequenceAll N patch tokens (576 at 336 px, thousands with tiling)Exactly K latents (32 in BLIP-2, 64 in Flamingo)None; patch tokens are external keys and values
    Prefill scaling in image sizeQuadratic, O((N+T)^2 d) in every layerConstant for the LLM, linear O(KN d) in the resamplerLinear, O(TN d) in the inserted layers only
    Added parametersSmallest; a 2-layer GELU MLP, roughly 20MMedium; about 188M for the BERT-base Q-FormerLargest; new attention plus FFN blocks scaled to the LLM width
    Training complexityLowest; align then instruction-tune on about 1.2M samplesHighest; needs a separate representation-learning stage to convergeModerate; the zero-init tanh gate makes the warm start stable
    Effect on a frozen LLMWeakest option when frozen; usually the LLM must be tunedWorks frozen, which is exactly why BLIP-2 used itBest; text-only behavior is provably unchanged at initialization
    Main weaknessContext blowup with high resolution, video, or many imagesFixed-K information bottleneck hurts OCR, charts, and countingExtra parameters and weaker reported OCR and reasoning transfer
    Representative modelsLLaVA, LLaVA-1.5, Qwen2-VL, InternVL, NVLM-DFlamingo resampler, BLIP-2, InstructBLIP, IdeficsFlamingo xattn-dense, Llama 3.2 Vision, NVLM-X

    Login to view more content