Tag: Transformer

  • DL0162 World Model Object Permanence

    How do world models maintain object permanence over long video generation horizons when an object is fully occluded behind another vehicle or building?

    Answer

    Object permanence is not a property a next-frame predictor gets for free. During a full occlusion the pixels that evidence the object are simply absent, so nothing in the current observation constrains what should re-emerge, and the only thing that can carry the object across the gap is state that outlives the pixels. Production world models therefore rely on three memory mechanisms, usually in combination: a long context of past frame latents that the generator can re-attend to, a recurrent latent state whose prior propagates unobserved objects forward, and an explicit pose-indexed geometric memory (object slots, 3D boxes, or a bird’s-eye-view layout) that is re-projected into the image when the occluder clears. Google DeepMind’s Genie 3 makes the first mechanism explicit, generating 720p frames at 24 fps with a reported visual memory extending roughly one minute into the past, while driving world models in the GAIA line lean on structured conditioning such as other agents’ 3D boxes and the ego trajectory. The practical question in an interview is therefore never “does the model understand permanence” but “does the information survive the occlusion window, and at what cost”, because a 2.5 second occlusion at 24 fps is 60 frames of pure extrapolation and the memory horizon either covers it or the object is re-invented rather than remembered.

    (1) Occlusion Is A Missing-Evidence Problem: the observation likelihood contributes nothing about the hidden object, so generation must fall back on the dynamics prior rather than on perception.
    (2) Long Context Buys Re-Readable Memory: keeping the last H frames of latents lets attention look back at the pre-occlusion view, at the price of a KV cache linear in H and a quadratic prefill.
    (3) Recurrent State Buys Constant Cost: a fixed-size latent s_t carries the object at O(1) memory per step, but its finite capacity makes identity attributes drift instead of vanishing abruptly.
    (4) Explicit 3D Memory Buys Correct Re-Projection: storing object records with poses turns re-emergence into geometry, so the vehicle reappears at the right pixel and the right moment.
    (5) The Failure Signature Differs Per Mechanism: a hard cliff when T_{\mathrm{occ}} exceeds H, a smooth decay for recurrent state, and mis-registration under ego-pose drift for geometric memory.
    (6) Rollout Stability Is A Separate Axis: teacher-forced training with fully autoregressive inference creates exposure bias, so small per-frame errors compound and corrupt identity even when the object is never occluded.

    Architecture diagram in which an observation, an action, and a video tokenizer feed three parallel memory blocks: a long-context attention cache over the last H frames, a recurrent latent state whose prior propagates hidden objects, and a pose-indexed 3D or bird's-eye-view memory holding explicit object slots; all three condition a diffusion or autoregressive generator that predicts the next frame, which is appended back into the context as an autoregressive loop

    Figure 1: Three places a hidden object can live. The generator is identical in all three cases; what changes is which memory still contains the occluded vehicle at frame t, and therefore whether the model re-renders the same car or invents a new one.

    The cleanest way to reason about the recurrent path is the standard latent-dynamics factorization used by Dreamer-style world models. A posterior q(s_t \mid s_{t-1}, a_t, o_t) fuses the new observation, while a prior p(s_t \mid s_{t-1}, a_t) predicts the next state without one. Under full occlusion the object’s contribution to the posterior disappears, so the model is effectively running the prior for T_{\mathrm{occ}} steps on that part of the scene, which is exactly the regime where capacity limits and accumulated error show up. Long-context attention avoids that open-loop integration by re-reading the original evidence, but only if the pre-occlusion frames are still inside the window: once they are evicted, the model has no way to distinguish “a red hatchback was there” from “some vehicle may exist”, and it samples a plausible fresh instance. Explicit memory sidesteps both problems by storing a symbol rather than a distributed code, which is why driving-domain world models condition on agent boxes and map layouts instead of hoping attention rediscovers them.

    Line chart of a target vehicle's lateral road position in metres against frame index from 0 to 140, with a shaded band marking a 60-frame full occlusion. The ground-truth trajectory is a dotted grey line; an explicit 3D memory model tracks it closely after the occlusion, a long-context model re-emerges about 1.2 metres off-lane and slowly converges back, and a short-context model produces no object after the occlusion until a spurious new vehicle appears far from the true trajectory

    Figure 2: What re-emergence actually looks like. The occlusion window is identical for all three models; the difference appears only after the occluder clears, where the short-context rollout hallucinates a fresh instance in the wrong lane and the long-context rollout keeps the object but mis-registers its position, while pose-indexed memory lands on the true trajectory.

    Mathematical Formulation:
    p(x_{1:T} \mid a_{1:T}) = \prod_{t=1}^{T} p(x_t \mid m_t, a_t)
    m_t = (x_{t-H:t-1},\; s_{t-1},\; \mathcal{M}_{t-1})
    q_t = q(s_t \mid s_{t-1}, a_t, o_t)
    p_t = p(s_t \mid s_{t-1}, a_t)
    T_{\mathrm{occ}} = \Delta t \cdot \mathrm{fps}
    H \geq T_{\mathrm{occ}}

    Where:

    • x_t is the generated frame latent at step t and a_t the conditioning action or control (steering, camera pose, text instruction).
    • m_t is everything the generator may condition on: the context window of past latents, the recurrent state, and the persistent geometric memory.
    • H is the memory horizon in frames and N_p the number of latent tokens per frame, so the window holds H N_p tokens.
    • q_t is the posterior that uses the observation o_t and p_t the prior that does not; under full occlusion the object is carried only by p_t.
    • \mathcal{M}_t is the explicit memory: object records with identity, extent, and pose, plus the camera pose needed to re-project them.
    • T_{\mathrm{occ}} is the occlusion length in frames, obtained from its duration \Delta t and the frame rate; the last line is the necessary condition for a pure context window to bridge it.
    • L and d are the number of attention layers and the model width, which set the cache and prefill costs below.

    Bridging A 2.5 Second Occlusion At 24 fps:
    T_{\mathrm{occ}} = 2.5 \times 24 = 60
    H N_p = 60 \times 256 = 15360
    \mathrm{cache} = O(H N_p L d)
    \mathrm{prefill} = O((H N_p)^2 d)
    R(600) = 0.995^{600} \approx 0.05

    Sixty frames of latents at 256 tokens per frame is 15,360 tokens of context bought for a single occlusion, and every additional second of horizon costs another 6,144 tokens of cache plus a quadratic increase in prefill work, which is precisely why real-time interactive world models cap H aggressively and then need a cheaper memory. The last line models the orthogonal failure: if identity is corrupted independently at each step with probability \delta = 0.005, the retention rate R(T) = (1-\delta)^{T} leaves only about 5% of objects intact after a 600-frame (25 second) rollout even with no occlusion at all. Permanence over long horizons is therefore two bugs wearing one coat: a horizon bug that shows up as a cliff, and a drift bug that shows up as exponential decay.

    Chart of correct re-emergence rate against occlusion duration in frames from 0 to 240 for four memory mechanisms: a 16-frame context window collapses sharply just after 16 frames, a 96-frame context window stays high then collapses just after 96 frames, a recurrent latent state decays smoothly and geometrically, and a pose-indexed 3D memory stays near 0.9 across the whole range, with vertical markers at the two context horizons and at the 60-frame mark

    Figure 3: Two distinct shapes of failure. Finite context gives a step cliff exactly at T_{\mathrm{occ}} = H, recurrent state gives geometric decay from capacity limits and compounding error, and explicit pose-indexed memory is nearly flat because duration costs it almost nothing.

    PropertyLong-context attentionRecurrent latent stateExplicit 3D / object memory
    What survives the gapRaw pre-occlusion frame latents, re-readable by attentionA compressed distributed code of the whole sceneSymbolic object records: identity, extent, pose, velocity
    Cost of a 60-frame occlusionAbout 15,360 cached tokens, with quadratic prefill growthOne fixed-size state vector, independent of durationA few object records plus one camera pose per frame
    Hard limitThe horizon itself: nothing outside H frames existsState dimensionality and compounding prior errorDetector, tracker, and pose accuracy; assumes rigid objects
    Dominant failure modeCliff: a fresh instance with new colour, size, and laneDrift: right object class, wrong attributes and timingMis-registration under pose drift, or duplicated instances
    Typical homeVideo diffusion transformers and interactive frame modelsDreamer-style latent world models for controlDriving world models conditioned on agent boxes and layouts

    Login to view more content
  • DL0161 World Model Safety Edge Cases

    How do world models simulate low-probability safety-critical edge cases such as tire blowouts or sudden pedestrian jaywalking for closed-loop planner stress testing?

    Answer

    A driving world model is an action-conditioned generative simulator p_\theta(z_{t+1} \mid z_t, a_t, c) that rolls forward latent state and decodes multi-view sensor observations, so the planner under test acts inside the rollout instead of replaying a fixed log. Rare events are never obtained by sampling the model unconditionally, because the learned distribution matches the fleet distribution in which a severe collision appears roughly once per 10^{8} miles. Instead the scenario is authored through conditioning: a low-dimensional parameter vector c holding occlusion geometry, jaywalk onset time, pedestrian speed, and surface friction is drawn from a biased proposal q(c) fitted by a search loop that maximizes criticality, then each rollout is reweighted by the likelihood ratio w = p(c)/q(c) so the resulting failure-rate estimate remains unbiased. A tire blowout is handled differently from a jaywalk, because it is a vehicle-dynamics discontinuity rather than an appearance change and almost no camera dataset contains it, so production stacks inject it in an analytic dynamics layer (collapsed cornering stiffness on one corner plus a yaw moment) while the world model supplies the surrounding traffic and imagery.

    (1) Closed Loop Requires Action Conditioning: the planner’s own control enters the model at every step, so log replay and open-loop video prediction cannot be used, since the ego trajectory diverges from the recorded one within a second or two.
    (2) Controllability Comes From Structured Conditioning: text, road layout, 3D agent boxes, and ego action are all conditioning channels, which turns “pedestrian steps out from behind the parked van 0.8 s before ego arrival” into an explicit specification rather than a hopeful prompt.
    (3) Rarity Comes From Biased Sampling: importance sampling with a cross-entropy-method proposal concentrates rollouts near the failure boundary, cutting the sample count for a fixed confidence by three to five orders of magnitude.
    (4) Unbiasedness Comes From Likelihood Ratios: reporting the raw failure fraction under q overstates real-world risk by exactly the sampling bias, so every rollout carries its weight w_i into the estimator.
    (5) Hybrid Physics For Fault Injection: blowouts, brake fade, and actuator latency live in a validated dynamics model, and the world model consumes the resulting ego state as a conditioning signal.
    (6) Plausibility Must Be Constrained: unconstrained adversarial search produces kinematically impossible agents and physically unavoidable collisions, so scenarios are filtered by a likelihood floor on \log p(c) and by an avoidability check against a reference planner.
    (7) Rollout Stability Bounds The Horizon: autoregressive generation accumulates drift, so useful stress tests run 10 s to 30 s at 10 Hz rather than minutes, and geometric consistency across views is monitored as a validity metric.

    Diagram of a closed-loop stress-testing system: real driving logs pretrain a generative world model, an analytic vehicle dynamics block injects tire blowout as reduced cornering stiffness and a yaw moment, the world model emits observations to the planner under test which returns actions, the rollout produces a criticality score, a scenario optimizer fits a biased proposal over scenario parameters, and a reweighted risk estimate combines failure indicators with importance weights

    Figure 1: Two loops, not one. The inner loop (world model and planner exchanging o_t and a_t) provides reactivity, while the outer loop (criticality score, proposal update, resampled c) provides rarity. Fault injection enters through the analytic dynamics block because the generative model has essentially no blowout data to learn from.

    The two example events stress different parts of the stack. A jaywalk is fundamentally a behavior and occlusion problem, and the world model is well suited to it: the pedestrian is spawned behind a parked vehicle, the onset time is set relative to the ego’s projected arrival, and the generated views must keep the occluder and the emerging body consistent across cameras so that the planner’s detector sees a realistic partial reveal. A blowout is a plant fault: within roughly 100 ms the affected corner loses most of its lateral capability and an asymmetric longitudinal force produces a yaw moment the driver did not command, so what the planner must handle is a sudden mismatch between commanded and achieved trajectory, not a novel image. Injecting it analytically also gives the parameter sweep something meaningful to search over, since severity, onset speed, and which corner fails are continuous knobs, whereas asking a video model to “show a blowout” yields visually plausible frames with no correct dynamics underneath them.

    Mathematical Formulation:
    z_{t+1} \sim p_\theta(z_{t+1} \mid z_t, a_t, c)
    o_t = g_\theta(z_t)
    a_t = \pi(o_{1:t})
    P_F = \mathbb{E}_{c \sim p}[\mathbf{1}\{F(c, \pi)\}]
    \hat P_F = \frac{1}{N}\sum_{i=1}^{N} w_i \mathbf{1}\{F(c_i, \pi)\}
    w_i = p(c_i) / q(c_i)
    \mathrm{RSE}_{\mathrm{MC}} = 1 / \sqrt{N P_F}

    Where:

    • z_t is the latent scene state, o_t = g_\theta(z_t) the decoded multi-view observation, and a_t the control emitted by the planner under test \pi.
    • c is the scenario parameter vector (occlusion offset, jaywalk onset, agent speeds, friction, fault severity), held fixed for a rollout and sampled per rollout.
    • p(c) is the nominal distribution estimated from fleet logs and q(c) the biased proposal from which c_i \sim q is actually drawn.
    • F(c, \pi) is the failure event for the closed-loop rollout (collision, or time-to-collision below a threshold) and \mathbf{1}\{\cdot\} its indicator.
    • w_i is the importance weight that removes the sampling bias, and i \in \{1,\ldots,N\} indexes the N rollouts in the campaign.
    • \mathrm{RSE}_{\mathrm{MC}} is the relative standard error of naive Monte Carlo, which is what makes small P_F unaffordable without a proposal.

    Blowout As A Dynamics Perturbation:
    \tilde C_{\alpha} = \beta C_{\alpha}
    M_z = \tfrac{1}{2} t_w \Delta F_x

    Here C_{\alpha} is the nominal cornering stiffness of the failed tire, \beta its residual fraction after deflation (often taken near 0.3 and ramped over about 100 ms), t_w the track width, and \Delta F_x the left-right longitudinal force asymmetry that generates the uncommanded yaw moment M_z. Both \beta and the onset ramp are entries in c, so the same search machinery that finds the worst jaywalk timing also finds the worst blowout severity at the worst road curvature.

    Sampling Budget For A 10^{-7} Event:
    N_{\mathrm{MC}} = 100 / 10^{-7} = 10^{9}
    10^{9} \times 30\ \mathrm{s} = 3 \times 10^{10}\ \mathrm{s}
    3 \times 10^{10} / 1000 = 3 \times 10^{7}\ \mathrm{s}
    N_{\mathrm{IS}} = 10^{9} / 10^{4} = 10^{5}
    10^{5} \times 30\ \mathrm{s} / 1000 = 3 \times 10^{3}\ \mathrm{s}

    Reaching a 10% relative standard error on a 10^{-7} event needs 10^{9} nominal rollouts, which at 30 s of simulated time each and 1000 parallel workers is about 347 days of wall clock. A proposal that delivers a 10^{4} variance-reduction factor brings the same confidence down to 10^{5} rollouts, or roughly 50 minutes. That ratio, not visual fidelity, is why rare-event machinery is the core of a stress-testing system.

    Two panels: the left panel plots the nominal density of time-to-collision at pedestrian entry peaking near three seconds against a biased proposal density peaking near one second, with the region below 0.6 seconds shaded as the failure region and annotated with its tiny nominal probability mass; the right panel is a log-log plot of estimator relative standard error against number of rollouts for naive Monte Carlo and for importance sampling, with a dashed ten percent target line crossed at one billion rollouts and one hundred thousand rollouts respectively

    Figure 2: Left: the nominal distribution puts almost no mass in the failure region, so the proposal is shifted onto the boundary and every sample is reweighted by p/q. Right: because naive relative error scales as 1/\sqrt{N P_F}, a 10^{4} variance-reduction factor moves the 10% confidence target from 10^{9} rollouts to 10^{5}.

    PropertyLog replayProcedural simulatorGenerative world model
    Closed-loop reactivityNone, other agents ignore the egoScripted or rule-based reactionLearned reaction conditioned on ego action
    Sensor realismPerfect for the original trajectory onlyGraphics-engine gap in texture and noiseHigh photometric realism, geometry can drift
    Authoring a rare eventImpossible, you can only wait for itHand-written scenario scriptsConditioning plus a searchable parameter vector
    Tire blowout fidelityOnly if a logged vehicle actually blew a tireGood, validated vehicle dynamics modelPoor alone, needs an analytic dynamics layer
    Rollout throughputVery high, no synthesis costHigh, especially at bounding-box abstractionLow, diffusion or autoregressive decoding per frame
    Dominant failure modeDivergence invalidates the log after ~1 sUnrealistic agent behavior distributionHallucinated geometry and long-horizon drift

    Login to view more content
  • DL0160 World Model Multimodal Futures

    How do world models handle multi-modal future distributions when a car at an intersection could turn left, turn right, or go straight, as in driving world models like Wayve’s GAIA?

    Answer

    The future at an intersection is genuinely multi-modal, so the first thing a world model must avoid is regression to the conditional mean. The minimizer of a squared-error objective is \mathbb{E}[x \mid c], which means a network that has perfectly learned that left, straight, and right are all plausible will output their average: a path down the median that no driver would ever take. The fix is architectural rather than a loss-weighting trick. A world model is built as a conditional sampler, not a point predictor, so drawing from it returns one internally consistent future at a time and the multimodality appears across draws rather than inside a single blurred output. Three mechanisms dominate in practice: a stochastic latent sampled at every rollout step (Dreamer-style RSSM), ancestral sampling of discrete tokens over a learned video codebook (GAIA-1-style), and iterative denoising from Gaussian noise (GAIA-2-style latent diffusion). Trajectory-level stacks add a fourth: a small set of anchors or mixture components with explicit probabilities, trained with a winner-take-all loss so each head owns one maneuver.

    (1) Squared Error Averages Modes: any L2-trained deterministic head converges to the mean of the modes, and at a T-junction that mean is a physically impossible maneuver even though it minimizes the loss.
    (2) Sample, Do Not Average: the model defines p(x \mid c) and multimodality is expressed by independent draws, each of which must remain a single coherent maneuver from first frame to last.
    (3) Stochastic Latents: an RSSM splits state into a deterministic recurrent part h_t and a sampled part z_t (DreamerV3 uses 32 categoricals of 32 classes), so branching happens once per step and is then carried forward consistently.
    (4) Discrete Token Sampling: quantize frames into codebook tokens and sample autoregressively with temperature or top-p, which turns mode choice into ordinary categorical sampling at the price of a long token sequence per second of video.
    (5) Explicit Mode Heads: K anchored components with probabilities \pi_k give the planner a calibrated, enumerable set of maneuvers instead of an opaque sampler, at the cost of a fixed mode budget.
    (6) Metrics Must Reward Coverage: single-sample L2 rewards mode averaging, so evaluation moves to \mathrm{minADE}_K, maneuver recall, and probability calibration, with K = 6 the standard budget on the Waymo Open Motion Dataset.

    Two top-down views of the same four-way intersection. On the left, three colored ground-truth trajectories leave the ego lane and turn left, continue straight, and turn right, while a thick red dashed line shows the squared-error optimum crawling up the middle of the junction and ending between the modes. On the right, twelve sampled trajectories from a stochastic world model, four per maneuver with varying speed and lateral jitter, each one a legal single maneuver covering all three modes.

    Figure 1: The same scene under two objectives. The L2 optimum is the pointwise average of the three maneuvers, so it drifts up the middle of the junction and matches none of them, while 12 draws from a stochastic model are individually legal and jointly cover all three modes. Nothing is wrong with the averaged model’s likelihood estimate of the mean; the problem is that the mean is not an admissible trajectory.

    Where the randomness enters decides how the model behaves in a rollout. In a latent state-space model the sample is a small categorical latent drawn once per timestep, so a single decision at the junction propagates through the recurrent state and the decoded frames stay consistent for the rest of the horizon; the risk is posterior collapse, where the KL term is tuned so aggressively that the prior stops carrying maneuver information and rollouts become deterministic again. In a discrete autoregressive model the sample is a token, and mode choice is spread over hundreds of tokens per frame, which makes temperature a global blur-versus-diversity knob: too low and every rollout goes straight, too high and lane geometry falls apart. Diffusion models place the randomness in the initial noise vector, giving the best sample fidelity and the most controllable conditioning, but they pay 20 to 50 network evaluations per sample and cannot easily produce a probability for each maneuver. Explicit mixture heads sit at the opposite end: a Wayformer-style model emits K = 6 Gaussian components with softmax weights in one forward pass of a few milliseconds, which is what a downstream planner actually wants, but six is a hard ceiling on expressible futures.

    Diagram with a left column of three boxes naming the sources of randomness, categorical latent sampling in a Dreamer-style RSSM, discrete token sampling over a video codebook as in GAIA-1, and Gaussian noise denoised by a diffusion model as in GAIA-2, next to a branching tree on the right where a context box splits into three colored maneuver branches that each split into two leaves labeled with maneuver variants and probabilities summing to one.

    Figure 2: All three families implement the same idea with different noise sources, and the tree shows why it works: a draw at the first branch commits to a maneuver, later draws only refine speed and gap acceptance, and the leaf probabilities recover the marginal maneuver distribution (0.28 left, 0.45 straight, 0.27 right). A deterministic model collapses this tree to its centroid.

    Mathematical Formulation:
    f^{*}(c) = \mathbb{E}[x \mid c]
    p(x \mid c) = \sum_{k=1}^{K} \pi_k \mathcal{N}(x; \mu_k, \Sigma_k)
    p(x \mid c) = \int p(x \mid z, c) p(z \mid c) \, dz
    p(x_{1:T} \mid c) = \prod_{t=1}^{T} p(x_t \mid x_{1:t-1}, c)

    Where:

    • x is the future to be predicted (a trajectory of waypoints or a sequence of frames) and f^{*}(c) is the squared-error optimum, which is the conditional mean and therefore not generally a valid maneuver.
    • c is the conditioning context: past observations, lane graph, ego speed, and traffic-light state.
    • k \in \{1, \ldots, K\} indexes mixture components or anchors, with weights \pi_k summing to one, means \mu_k, and covariances \Sigma_k; K = 6 is the standard benchmark budget.
    • z is the stochastic latent whose prior p(z \mid c) carries the mode choice; marginalizing it makes p(x \mid c) multi-modal even when p(x \mid z, c) is unimodal.
    • t \in \{1, \ldots, T\} indexes rollout steps or tokens, and the product form is the ancestral sampling factorization used by discrete-token world models.

    Why L2 Prefers The Impossible Path (two equally likely 8 m lateral outcomes):
    f^{*} = 0.5(-8) + 0.5(+8) = 0
    \mathrm{MSE}(f^{*}) = 0.5(64) + 0.5(64) = 64
    \mathrm{MSE}(\mu_1) = 0.5(0) + 0.5(256) = 128

    Committing to a real maneuver scores twice as badly as predicting the physically impossible average, which is the whole reason single-output regression is untrustworthy here. Mode-based training removes the incentive by only penalizing the closest component and learning the weights separately, and rollout models remove it by making the loss a likelihood rather than a distance.

    Mode-Based Training And Scoring:
    k^{*} = \arg\min_{k} \lVert x - \mu_k \rVert
    \mathcal{L}_{\mathrm{reg}} = \lVert x - \mu_{k^{*}} \rVert^2
    \mathcal{L}_{\mathrm{cls}} = -\log \pi_{k^{*}}
    \mathrm{minADE}_K = \min_{k} \mathrm{ADE}(\hat{x}^{(k)}, x)
    \mathrm{ADE}(\hat{x}, x) = \frac{1}{T} \sum_{t=1}^{T} \lVert x_t - \hat{x}_t \rVert

    The evaluation side matters as much as the model. Reporting a single-sample average displacement error silently rewards mode averaging, so benchmarks score \mathrm{minADE}_K and \mathrm{minFDE}_K over K samples, plus a mAP-style metric that requires the probabilities to be calibrated and not just the geometry to be covered. That combination is deliberate: \mathrm{minADE}_K alone can be gamed by spraying diverse but implausible samples, while likelihood alone can be won by a model that puts all its mass on “straight” because straight is the majority class at most intersections. In production the planner consumes both, treating each mode as a separate scenario to cost, so a mode that is missing from the sample set is a scenario the planner never considers.

    Left panel: line chart of minADE in meters versus number of sampled futures K from 1 to 24, with a calibrated diverse sampler falling steadily below one meter, a mode-collapsed sampler plateauing near 1.8 meters, and a dashed horizontal line for a single deterministic prediction at 3.1 meters, with a vertical dashed line marking the benchmark budget K equals 6. Right panel: bar chart of maneuver coverage at that budget, 0.34 for the deterministic head, 0.61 for the collapsed generative model, and 0.93 for the calibrated generative model, with value labels above the bars.

    Figure 3: Drawing more samples only helps if the samples differ. A mode-collapsed sampler flattens out near 1.8 m because sample 6 repeats sample 1, while a diverse sampler keeps improving; the bar panel shows the consequence the planner feels, namely how often the maneuver the other car actually performed is present anywhere in the predicted set.

    PropertyAnchored mixture headLatent state-space (RSSM)Discrete token ARLatent diffusion
    Source of multimodalityK anchors with softmax weightsCategorical latent drawn each stepTemperature or top-p token samplingInitial Gaussian noise vector
    Cost per futureOne forward pass gives all KT cheap recurrent stepsHundreds of tokens per frame20 to 50 denoising steps
    Explicit probabilitiesYes, directly usable by a plannerOnly via repeated samplingSequence likelihood, hard to readNo tractable density
    Expressible futuresCapped at K (usually 6)Combinatorial in latent codesUnbounded, pixel-level detailUnbounded, highest fidelity
    Dominant failureDead heads under winner-take-allPosterior collapse, deterministic rolloutsLow temperature collapses to majority modeLatency, and no calibrated mode weights

    Login to view more content
  • DL0159 Counterfactual Simulation for Driving

    What is counterfactual simulation in autonomous driving, and how do world models let safety engineers ask what would happen if the ego vehicle had braked two seconds earlier?

    Answer

    Counterfactual simulation re-runs one specific logged drive with exactly one thing changed, usually the ego vehicle’s own action sequence, and then asks what the rest of the world would have done in response. It is Pearl’s three-step recipe applied to a driving log: abduction → action → prediction. First infer the latent variables z that explain the observed log, including road geometry, occlusions, and each neighbour’s intent and aggressiveness. Then intervene by substituting a new ego plan a', such as brake onset two seconds earlier, and roll the scene forward under that intervention. The hard part is not the ego kinematics, which a closed-form formula settles in one line; the hard part is that every other agent’s logged trajectory becomes invalid the instant the ego behaves differently, so a naive non-reactive log replay manufactures collisions that could never have happened. A world model supplies the missing conditional distribution p(s_{t+1} \mid s_t, a'_t, z), generating plausible reactions for surrounding traffic either as trajectories over a structured scene or as generated sensor frames, and because those reactions are stochastic the answer is a distribution over outcomes estimated from many sampled rollouts rather than a single verdict.

    (1) Counterfactual, Not Merely Interventional: p(Y \mid do(a')) averages over all scenes that could occur, while the counterfactual p(Y_{a'} \mid o_{1:T}, a_{1:T}) conditions on the evidence of this exact log, so the same pedestrian keeps the same intent.
    (2) Abduction Fixes The World: inferring z from the log is what makes the rollout a rerun of that day rather than a generic scenario with similar statistics.
    (3) Reactivity Is The Whole Problem: logged responses are only valid for the logged ego action, so frozen playback agents produce fake rear-end contacts and hide genuine near misses.
    (4) Divergence Horizon: simulated and logged states separate as the intervention propagates, so a counterfactual is trustworthy over a few seconds and becomes speculation over tens of seconds.
    (5) Sample, Never Simulate Once: outcome metrics are estimated from N rollouts with confidence intervals, since one lucky rollout is not evidence of avoidance.
    (6) Metrics Decide The Verdict: contact or no contact, impact speed and delta-V, minimum time-to-collision, and whether the newly introduced risk (an in-lane stop, an induced rear-end) offsets the risk removed.

    Five-stage pipeline from left to right: observe the logged drive, abduct the latent scene state and agent intents, intervene by replacing the ego plan with a brake two seconds earlier, roll out the world model with reacting neighbours, and score the outcome, with a second row showing the corresponding notation under each stage

    Figure 1: A counterfactual is not a fresh simulation. Step 2 abducts the latent scene so the neighbours keep the dispositions they actually had, step 3 changes only the ego action, and step 4 must re-generate every response because the logged responses are no longer admissible evidence.

    Three simulator families answer step 4 with very different fidelity. Log replay keeps every neighbour on its recorded trajectory, which is cheap and perfectly grounded for the first fraction of a second and actively misleading afterwards. Rule-based reactive agents (car-following plus lane-change models) give physically consistent responses at negligible cost but with a narrow behavioural repertoire that tends to be too polite, biasing avoidance estimates optimistically. Learned world models sit at the top: trajectory-level sim agents of the kind benchmarked in the Waymo Open Sim Agents Challenge, LiDAR-space models such as Copilot4D, and pixel-space generative models such as Wayve’s GAIA line, which can re-render the camera stream so the perception stack is exercised too rather than being handed ground-truth tracks. Regulatory use of this machinery is already public: Waymo reconstructed fatal crashes inside its operating domain and simulated its driver in place of each human participant, both as crash initiator and as responder, reporting avoided-or-mitigated outcomes against a non-impaired, eyes-always-on reference driver. The credibility of any such claim rests on how well the simulator’s agents were validated, not on how photorealistic the rollout looks.

    Two time versus distance panels for the same counterfactual. Left panel shows log replay where the following vehicle keeps a straight logged trajectory and intersects the braking ego, marked as a fake rear-end. Right panel shows a reactive world model where the follower brakes after a reaction delay and stops short of the ego, with the logged ego trajectory reaching the stopped lead vehicle at 100 metres in both panels

    Figure 2: The same intervention, two simulators. With frozen playback the follower drives into the decelerating ego and the tool reports an 18.9 m/s rear-end that never existed, while a reactive model has the follower brake 0.9 s after the brake lights and stop 5.3 m short. Both panels agree on the ego: braking two seconds earlier turns a 12.6 m/s frontal impact into a stop 26.7 m short of the obstacle.

    Mathematical Formulation:
    z \sim p(z \mid o_{1:T}, a_{1:T})
    a'_t = \pi'(\hat{s}_t)
    \hat{s}_{t+1} = f(\hat{s}_t, a'_t, z)
    Y_{a'} \sim p(Y \mid z, a'_{1:T})
    \Delta R = R(\tau) - \mathbb{E}[R(\tau')]

    Where:

    • o_{1:T} and a_{1:T} are the observed log, meaning the recorded sensor stream plus tracks and the ego actions that were actually executed.
    • z is the abducted latent state: map geometry, occupancy behind occlusions, and per-agent intent and aggressiveness, held fixed across the counterfactual.
    • \pi' is the counterfactual policy and a'_t its action, here a brake command issued 2 s earlier than in the log; \hat{s}_t is the simulated joint state of ego plus neighbours.
    • f is the world model transition, the only component that can supply neighbour responses to an action that was never taken.
    • Y_{a'} is the counterfactual outcome variable (contact, impact speed, minimum TTC) and its distribution is estimated from N independent rollouts \tau'.
    • R is a scalar risk or severity functional, so \Delta R is the risk actually removed by the intervention, and it can be negative when the new action introduces its own hazard.

    Braking Two Seconds Earlier At 20 m/s:
    d_{\mathrm{brake}} = \frac{v^2}{2a}
    = \frac{20^2}{2 \times 6} = 33.3\ \text{m}
    \Delta d = v \Delta t = 20 \times 2 = 40\ \text{m}
    v_{\mathrm{imp}} = \sqrt{v^2 - 2 a d}
    = \sqrt{400 - 240} = 12.6\ \text{m/s}

    In the logged run the brake came on with only 20 m left to a stopped lead vehicle, so the ego arrived at 12.6 m/s. The intervention adds 40 m of room, giving 60 m against the 33.3 m the ego needs, which is why it stops 26.7 m short. Notice how weak the two-second question actually is: the shortfall was 33.3 - 20 = 13.3 m, so 0.67 s of extra warning already avoids contact, and everything beyond that buys margin rather than outcome. The engineering value of the simulator therefore lies in the second-order effects that closed-form kinematics cannot see, above all the induced risk from an earlier, harder, cause-free deceleration in front of a following vehicle.
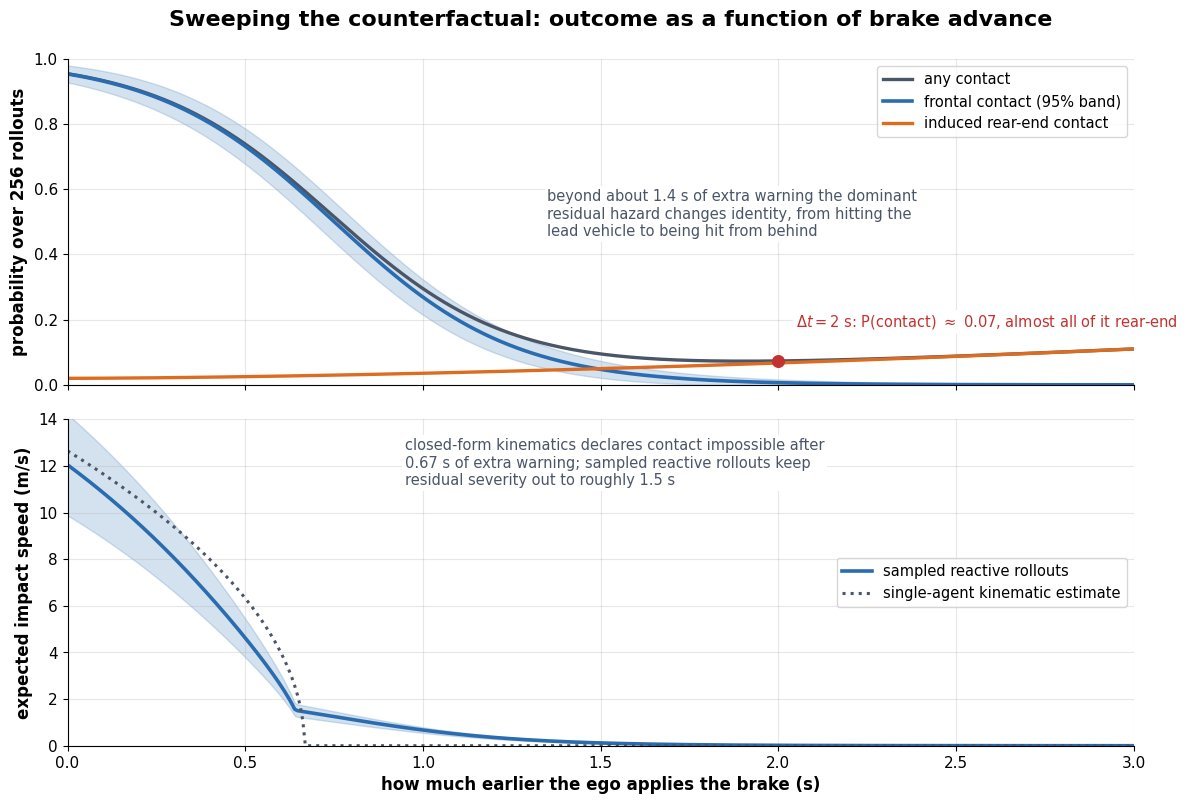
    Two stacked charts against how much earlier the brake is applied. The upper chart plots probability of any contact, frontal contact with a confidence band, and rear-end contact over 256 rollouts, with frontal risk falling from near one to near zero and rear-end risk rising slowly. The lower chart plots expected impact speed from sampled reactive rollouts against a dotted single-agent kinematic estimate that reaches zero at 0.67 seconds

    Figure 3: Sweeping the intervention turns one question into a curve. Frontal risk collapses within about one second of extra warning while rear-end exposure grows, so past roughly 1.4 s the dominant residual hazard has changed identity. The dotted line shows why sampling matters: the single-agent kinematic estimate declares the crash impossible after 0.67 s, whereas reactive rollouts still assign residual severity out to about 1.5 s.

    PropertyLog replay (non-reactive)Rule-based reactive agentsLearned world model
    Neighbour behaviourFrozen to the recorded trajectory, blind to the new ego actionCar-following and lane-change heuristics with hand-set reaction timesSampled from a learned conditional distribution over joint futures
    Valid horizonOnly until the ego state diverges, often under 0.5 sSeconds, as long as the manoeuvre stays inside the rule setSeconds to tens of seconds, limited by compounding rollout error
    What is simulatedEgo dynamics only, on ground-truth perceptionEgo plus abstract agent boxes, still on ground-truth perceptionTrajectories, occupancy, LiDAR, or camera frames, so perception can be tested in the loop
    Cost per rolloutNegligible, millions of segments per nightMilliseconds, fully parallel across scenariosAccelerator seconds per simulated second for generative sensor rollouts
    Dominant failure modeFabricated collisions and hidden near missesOver-polite traffic that inflates avoidance ratesHallucinated agents, causal confusion, and quiet drift out of distribution
    Best used forRegression checks on planner outputs in unchanged scenesLarge-scale sweeps and worst-case bounds with auditable assumptionsHigh-stakes crash reconstruction and long-tail scenario editing

    Login to view more content
  • DL0158 3D-Aware World Model Geometry

    How do 3D-aware latent world models use geometric inductive biases such as 3D Gaussian Splatting and NeRFs to ensure view-consistent camera rollouts?

    Answer

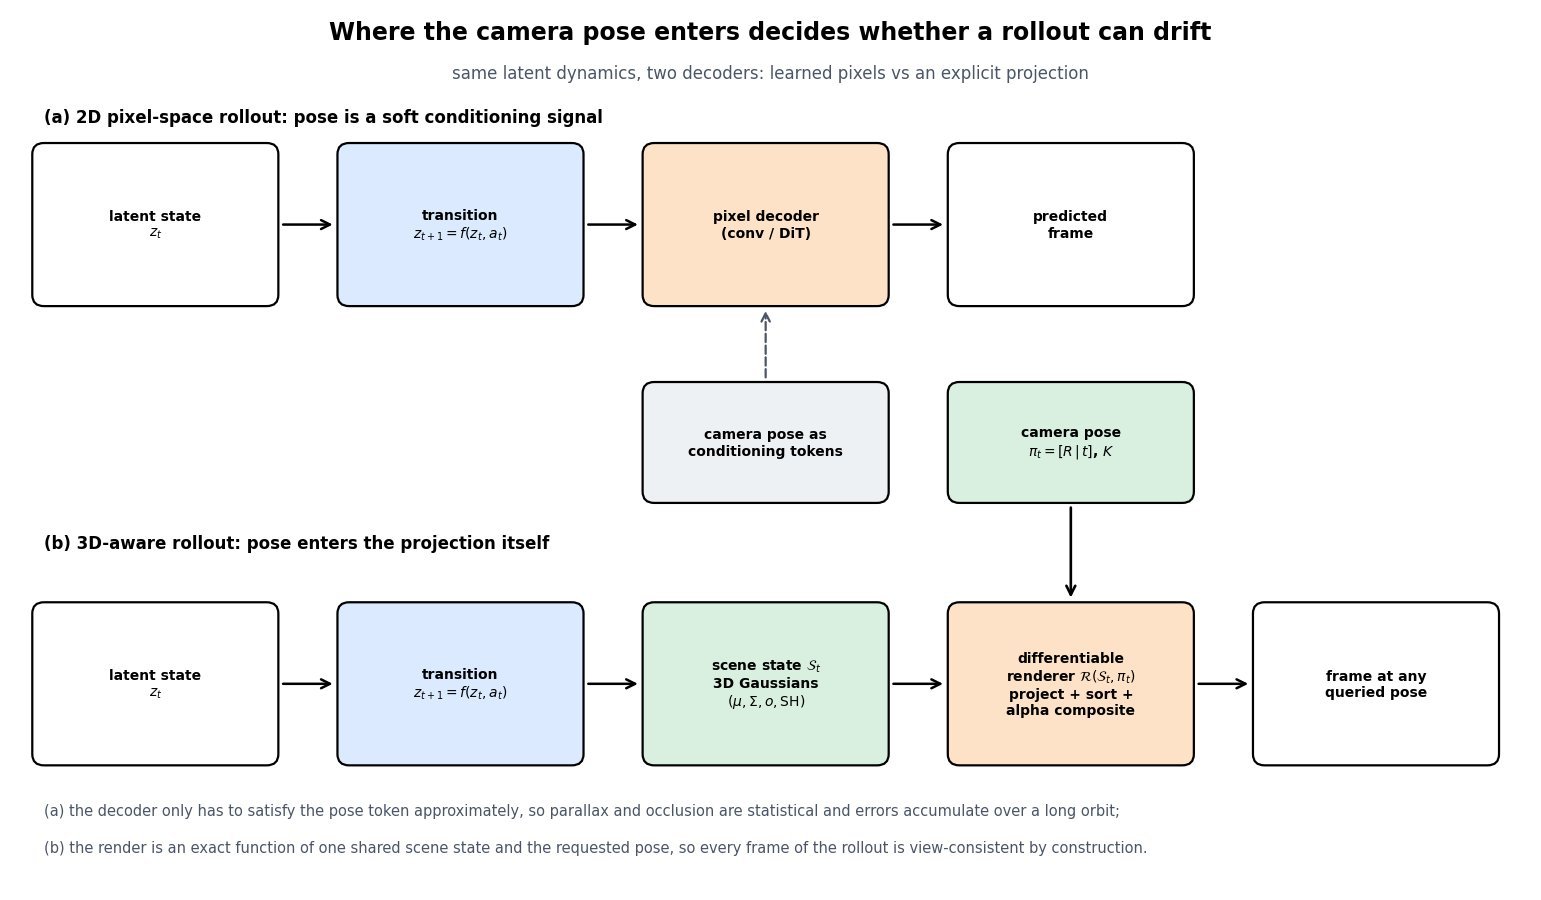
    A 3D-aware world model never lets a decoder invent pixels directly. Its latent transition predicts a scene state (a set of anisotropic 3D Gaussians, or the weights and features of a radiance field), and the only path from that state to an image is a differentiable renderer that takes the camera extrinsics and intrinsics as explicit arguments. Because every frame of a rollout is a deterministic function of one shared geometry, parallax, occlusion ordering, and disparity are produced by projection math rather than learned from data, so a camera can orbit for hundreds of steps without the scene mutating underneath it. NeRF contributed the volumetric rendering equation that made this pipeline differentiable end to end. 3D Gaussian Splatting keeps exactly the same alpha-compositing math but replaces per-ray marching with tile-based rasterization, which cuts per-frame cost by two to three orders of magnitude and is what makes closed-loop, interactive camera rollouts possible at all. The bias is not free: it guarantees consistency only where geometry is supported, so unobserved regions, topology changes, and strong view-dependent effects still require a generative prior layered on top.

    (1) Render, Do Not Predict: the decoder is replaced by \mathcal{R}(\mathcal{S}_t, \pi_t), so the camera pose enters as a projection matrix instead of a conditioning token the network may ignore.
    (2) One State, Many Views: all views share a single geometry, which turns multi-view consistency from a learned behaviour into an architectural invariant up to the representation’s capacity.
    (3) Two Renderers, One Equation: NeRF integrates density along rays while 3DGS rasterizes projected Gaussians, but both use the same front-to-back alpha compositing, so the geometric bias is identical and only the cost model differs.
    (4) Dynamics Live In Scene Space: time is handled by a deformation field or 4D Gaussians that move primitives, so motion cannot silently destroy the identity of an object the way pixel-space prediction can.
    (5) Latency Decides Feasibility: a world model must render inside the control loop, and rasterization at roughly 5-10 ms per 1080p frame versus seconds for vanilla volumetric marching is the difference between a usable simulator and an offline reconstruction.
    (6) Where The Bias Stops Helping: unobserved regions, non-rigid topology change, transparency, and monocular scale ambiguity are outside the guarantee and are exactly where a generative prior must take over.

    Two-row architecture comparison. The top row shows a latent state feeding a transition function then a 2D pixel decoder that emits a predicted frame, with camera pose supplied only as conditioning tokens through a dashed arrow. The bottom row shows the same latent state and transition producing an explicit scene state of 3D Gaussians with position, covariance, opacity and spherical harmonics, which passes through a differentiable renderer that projects, sorts and alpha-composites, with the camera pose entering as extrinsics and intrinsics, emitting a frame at any queried pose.

    Figure 1: The same latent dynamics, two decoders. In the pixel-space path the pose is a soft conditioning signal the decoder may only approximately honour, so geometric errors compound across a long orbit. In the 3D-aware path the pose is an argument of an exact projection, so consistency holds by construction and the model’s remaining job is predicting geometry rather than predicting appearance.

    The mechanism that actually enforces consistency is worth stating precisely. A pixel is a function of the primitives that project onto it, sorted by depth, so moving the camera changes the projected position of a primitive by an amount inversely proportional to its depth. That single fact gives the renderer correct parallax, correct occlusion ordering when a near primitive covers a far one, and correct disocclusion when the camera slides sideways, all without any of it appearing in the loss as a special term. Training only needs a photometric loss on the observed views; the geometry that explains several views simultaneously is the only geometry that can drive that loss to zero, which is why a well-fit scene state extrapolates to nearby unseen poses. A 2D video model has to learn the same relationships as correlations over pixels, and it has no mechanism preventing a later frame from contradicting an earlier one.

    Left panel is a top-down view of a scene with two camera poses at the bottom, dotted view frustums, a near orange elliptical splat at depth 2.8 and a far blue elliptical splat at depth 5.6, with solid rays drawn from each camera to each splat centre. Right panel shows the two resulting image strips stacked vertically, with orange and blue markers at the projected horizontal positions, and two double-headed arrows measuring that the near splat shifts 0.73 of the frame width between the views while the far splat shifts only 0.37, a ratio of exactly two matching the depth ratio.

    Figure 2: Why a shared 3D state is a hard constraint. Both renders come from one set of primitives, so the horizontal shift of each splat is fixed by its depth: the near splat moves exactly twice as far as the splat at twice the distance. A pixel-space decoder must reproduce this ratio from statistics, whereas the renderer cannot violate it, which is the entire content of the phrase geometric inductive bias.

    Mathematical Formulation:
    z_{t+1} = f(z_t, a_t)
    \mathcal{S}_t = g(z_t)
    I_t = \mathcal{R}(\mathcal{S}_t, \pi_t)

    Shared Rendering Equation:
    C(p) = \sum_{i=1}^{N} T_i \alpha_i c_i
    T_i = \prod_{j=1}^{i-1} (1 - \alpha_j)
    \alpha_i^{\mathrm{nerf}} = 1 - \exp(-\sigma_i \delta_i)
    \alpha_i^{\mathrm{gs}} = o_i \, G_i(p)
    \Sigma = R S S^{\top} R^{\top}
    \Sigma' = J W \Sigma W^{\top} J^{\top}
    \mu_i(t) = \mu_i + \Delta\mu_i(z_t)

    Where:

    • z_t is the compact latent state, a_t the action, and f the learned transition model; g decodes the latent into a scene state rather than into pixels.
    • \mathcal{S}_t is the geometric state: for 3DGS a set of primitives \{\mu_i, \Sigma_i, o_i, \mathrm{SH}_i\}, for a NeRF a field returning density and colour at a queried point and direction.
    • \pi_t = (R \mid t, K) is the camera pose and intrinsics, and \mathcal{R} the differentiable renderer; I_t is the frame, so any pose can be queried at any rollout step.
    • C(p) is the colour of pixel p, i indexes the N contributions sorted front to back, c_i is the view-dependent colour, and T_i is the accumulated transmittance that produces occlusion for free.
    • \sigma_i is the volume density at sample i and \delta_i the spacing between adjacent samples along the ray; o_i is a Gaussian’s opacity and G_i(p) its projected 2D density evaluated at the pixel.
    • \Sigma is the world-space covariance factored into rotation R and scale S so it stays positive semi-definite under gradient descent, and \Sigma' is its screen-space projection through the viewing transform W and the affine Jacobian J.
    • \Delta\mu_i(z_t) is the predicted per-primitive displacement from a canonical configuration, which is how dynamics enter without breaking the static consistency guarantee at each instant.

    The cost model is what selects the representation in practice. Volumetric marching evaluates a network at every sample on every ray, so a vanilla NeRF pays roughly 2 \times 10^{6} rays times 192 samples for one 1080p frame, which is hundreds of millions of queries. Hash-grid encodings shrink the per-query cost by orders of magnitude but keep the same per-ray structure. Rasterization instead touches each Gaussian once, splats it into the tiles it covers, and blends sorted contributions, which turns rendering into a bandwidth-bound pass rather than a compute-bound integral. That is the reason 3D-aware world models became practical after 2023 rather than after 2020.

    Log-log line chart of milliseconds per frame versus output resolution in megapixels for three renderers: vanilla NeRF with 192 samples per ray at about 47000 milliseconds per megapixel, a hash-grid accelerated field at about 15 milliseconds per megapixel, and 3D Gaussian rasterization at about 3.7 milliseconds per megapixel, with horizontal reference lines at the 33 millisecond thirty frames per second budget and the 11 millisecond ninety frames per second budget, and an annotation marking that rasterization renders 1080p in roughly 8 milliseconds.

    Figure 3: The geometric bias is only usable if you can afford to render. All three curves are linear in pixel count, so the gaps are constant multipliers: rasterization clears the 33 ms interactive budget at 1080p with room to spare, a hash-grid field sits near the edge, and vanilla volumetric marching is four orders of magnitude away, which restricts it to offline reconstruction rather than in-the-loop camera rollouts.

    Property2D latent video world modelNeRF-style radiance field3D Gaussian splats
    Scene representationLatent tokens or 2D feature maps, no explicit geometryImplicit continuous field returning density and colourExplicit primitives with position, covariance, opacity, spherical harmonics
    How the camera entersConditioning embedding, a soft constraint the decoder can bendDefines ray origins and directions used for samplingEnters the viewing transform and the projection Jacobian
    Cost per 1080p frameOne pass of a large decoder, tens to hundreds of msSeconds for a vanilla MLP field, tens of ms with hash gridsSingle rasterization pass, roughly 5-10 ms
    View consistencyStatistical, drifts as the orbit lengthensExact for supported geometryExact for supported geometry, same compositing math
    DynamicsNative, learned directly in latent or pixel spaceTime-conditioned field or canonical space plus deformationPer-primitive deformation or 4D Gaussians
    Dominant failure modeHallucinated geometry and object identity flicker on return viewsSlow to fit and render, blurry thin structures, hard to editFloaters and popping in unobserved regions, memory grows with primitive count

    Login to view more content
  • DL0157 VLA Zero-Shot and Few-Shot Transfer

    How do you evaluate zero-shot and few-shot transfer of generalist VLA policies to novel physical environments and unseen manipulation objects, for a checkpoint such as Google DeepMind’s RT-2 or the open OpenVLA model?

    Answer

    Evaluating transfer is a measurement design problem, not a demo reel. The protocol must vary one generalization axis per evaluation cell, hold everything else fixed with a scripted scene reset and matched initial states, and report a per-axis success rate with a confidence interval instead of one aggregate number. Zero-shot cells run the frozen checkpoint at k = 0 demonstrations, while few-shot cells sweep k \in \{1, 5, 10, 25\} target demonstrations and report a curve plus the retention on the original seen-task suite after adaptation. The trial budget sets the resolution of the entire experiment, because 20 trials per cell give a 95% interval of roughly \pm 22 points at \hat{p} = 0.5, which cannot resolve the 10 to 15 point differences people actually argue about. Cheap simulation suites such as LIBERO and SIMPLER buy statistical power and reproducibility, and real-robot paired trials buy validity, so a credible report uses both and checks that they rank policies the same way.

    (1) Factor-Isolated Axes: Split “novel” into unseen object instance, unseen object category, unseen scene and background, added distractors and camera pose, and rephrased language. A single mixed “hard eval” set cannot attribute a failure to any one of them.
    (2) Matched Initial States: Every policy under comparison sees the same object poses, lighting, and clutter, logged from a reset script or a fixture template, which turns a noisy independent comparison into a paired test with far more power.
    (3) Trial Budget Sets Resolution: Detecting a 10-point difference at 95% confidence needs roughly 190 trials per arm, so 20-trial evals should be reported as pilots, never as rankings.
    (4) Progress Score, Not Only Binary Success: Score reach, grasp, transport, and place as staged partial credit in [0, 1], which exposes whether a novel object breaks perception or grasp geometry.
    (5) Few-Shot Is A Curve: Report \hat{p}(k) over several k values and fit a demo-efficiency constant, because a single k = 10 number hides whether the policy needed 2 demos or 50.
    (6) Retention And Blind Operation: Re-run the seen-task suite after fine-tuning to measure catastrophic forgetting, and keep the operator unaware of which checkpoint is running to remove reset and intervention bias.

    Protocol diagram with five generalization axis lanes on the left (unseen object instances, unseen object categories, unseen scene, unseen distractors with camera pose shift, rephrased instructions) feeding a tall paired-trial harness box that specifies scripted resets, matched initial states, a blind operator, randomized trial order, N trials per cell and a staged progress score, which then splits into a zero-shot arm at k equals zero demos and a few-shot arm at k equals 1, 5, 10, 25 demos, each producing its own report block

    Figure 1: One checkpoint, one factor per cell. The harness is the part people skip: without scripted resets and matched initial states, the operator becomes an uncontrolled variable, and the same policy can swing 20 points between two afternoons. Each cell also carries a seen-object control in the new scene, so a gap can be attributed to the object rather than to the room.

    The protocol hygiene matters more than the model comparison. Each trial follows a fixed loop, reset → verify pose against a reference photo → run for a hard time limit → score stages → log the episode, and every episode is kept, including ones the operator considers unfair, because discarding “bad setups” is how a 55% policy becomes an 80% policy on paper. Interventions must be recorded rather than silently corrected, since a policy that needs one nudge per episode is not transferring. On the few-shot side, the demonstrations for a novel object must be collected under the same distribution the evaluation will use, and the evaluation objects must be held out from those demonstrations; reusing the same physical mug for teaching and testing measures memorization, not transfer. Finally, adaptation method is part of the result: LoRA on the action head, full fine-tuning, and fine-tuning with a replay mix of pretraining data produce very different retention curves at the same novel-task success.

    Mathematical Formulation:
    \hat{p} = \frac{1}{N}\sum_{i=1}^{N} s_i
    \mathrm{CI}_{95} = \hat{p} \pm 1.96\sqrt{\hat{p}(1-\hat{p})/N}
    G_a = \hat{p}_{\mathrm{seen}} - \hat{p}_a
    N \geq 2 z^2 \bar{p}(1-\bar{p}) / \Delta^2
    \hat{p}(k) = p_{\infty} - (p_{\infty} - p_0)e^{-k/\tau}

    Where:

    • \hat{p} is the estimated success rate of one evaluation cell and s_i the outcome of trial i, either binary or a staged progress score in [0, 1].
    • N is the number of trials in that cell, the single quantity that decides whether the reported number can support a claim.
    • G_a is the generalization gap on axis a, measured against the seen-task control run in the same session and the same scene.
    • z = 1.96 at 95% confidence, \bar{p} is the pooled rate of the two arms, and \Delta is the minimum detectable difference you are willing to claim.
    • k is the number of target-domain demonstrations, p_0 the zero-shot rate, p_{\infty} the saturation rate, and \tau the demo-efficiency constant in demonstrations, so smaller \tau means faster adaptation.
    • The unpaired formula for N is an upper bound; matched initial states reduce the variance of the difference and can cut the required N by a factor of two or more.

    Trial Budget For A 10-Point Claim:
    N \geq 2(1.96)^2(0.5)(0.5)/(0.10)^2
    N \geq 192

    At roughly 90 seconds per real trial including reset, 192 trials per arm is about 5 hours of operator time for a single cell, and a five-axis grid with two policies multiplies that by ten. That arithmetic, not modelling taste, is why teams push generalization sweeps into simulation and reserve real hardware for a small number of decisive paired comparisons, and why crowd-sourced or autonomous evaluation has become an active research direction.

    Two panel chart: left panel shows per-axis success rate bars for seen tasks, novel object instance, novel object category, novel scene, added distractors and rephrased instruction, each with a wide red 95 percent interval for 20 trials and a narrow black interval for 200 trials, showing that the 20 trial intervals overlap across axes; right panel plots success rate against number of demonstrations per novel task at k equals 0, 1, 3, 5, 10 and 25 for novel object and novel scene curves rising toward saturation, plus a declining dashed curve for retention on the original seen task suite after naive fine-tuning

    Figure 2: Left, the same measurements at two trial budgets. With 20 trials per cell the intervals for novel instance, distractors, and rephrasing all overlap, so the axis ranking is unsupported; at 200 trials the ordering becomes real. Right, few-shot transfer is a curve with a second axis nobody reports: novel-task success climbs with k while seen-task retention decays under naive fine-tuning.

    PropertySimulation suites (LIBERO, SIMPLER, CALVIN)Real-robot paired trials
    Cost of 100 trialsMinutes of wall clock, fully parallel across workers2 to 3 hours of operator time plus fixtures and resets
    Axes varied cheaplyObject mesh and texture, lighting, camera pose, distractor count, instruction textAnything physically buildable, but each new factor costs a scene rebuild
    What it missesContact dynamics, deformables and liquids, actuator lag, real camera noise and exposureNothing by construction, since it is the deployment distribution
    Achievable precisionThousands of trials, interval within a few points20 to 50 trials is typical, giving intervals of 15 to 22 points
    Dominant validity riskRank inversion versus hardware, and policies tuned to the rendererOperator drift, inconsistent resets, unlogged interventions, cherry-picked episodes
    Right roleWide axis sweeps, regression gates, hyperparameter and checkpoint selectionA few decisive head-to-head comparisons and the final transfer claim

    Login to view more content
  • DL0156 Force-Torque and Visual Fusion in VLA

    How do force-torque sensor inputs and joint currents fuse with visual features inside VLA cross-attention layers to handle physical contact tasks?

    Answer

    Fusion begins with tokenization, not with attention: a 6-axis wrench sampled at 1 kHz and the per-joint motor currents are cut into short windows (typically 50-200 ms), pushed through a small 1D CNN or spectrogram encoder, pooled down to roughly one token per 10 ms, and projected by a learned matrix into the same d-dimensional space that holds the visual patch tokens. Inside the block, the language and vision residual stream supplies the queries while the concatenated visual and proprioceptive tokens form the key/value memory, so softmax attention decides layer by layer how much contact evidence to read instead of averaging modalities with fixed weights. Because the pretrained VLM has never seen a wrench token, the cross-attention output is normally added through a zero-initialized tanh gate, which makes the new modality an exact no-op at initialization and lets it grow in during robot fine-tuning without destroying the language prior. The two streams also carry different information: vision says where and what, force says when and how hard, and force is the only channel that survives occlusion once the tool is inside the hole. What this fusion cannot do is close the contact loop, since one VLA forward pass costs 50-200 ms while an impact transient decays in a few milliseconds, so the policy emits setpoints, target wrenches, and impedance gains for a 1 kHz low-level controller that does the actual reacting.

    (1) Window Then Tokenize: a 1 kHz stream cannot enter a 5 Hz backbone sample by sample, so it is windowed and pooled into about 10 tokens per 100 ms, which keeps the added sequence length near 2 percent of a two-camera observation.
    (2) Shared Embedding Space: a per-modality encoder plus a linear projection is what makes wrench tokens, current tokens, and patch tokens legal keys in the same attention operation.
    (3) Queries From The Stream, Keys From The Sensors: cross-attention is asymmetric on purpose, so the policy can ignore force during free-space motion and attend heavily to it during contact.
    (4) Zero-Init Gating: \tanh(\alpha) with \alpha = 0 preserves the pretrained VLM at step zero and is the standard fix for adding a modality that was absent from web-scale pretraining.
    (5) Action Space Must Be Contact-Aware: position-only outputs cannot express compliance; the head has to emit a target wrench or stiffness and damping for an impedance or admittance law.
    (6) Frequency Separation: the transformer supervises at 5-10 Hz and the 1 kHz controller reflexes, because policy latency is roughly 30 times longer than the impact transient it would need to catch.

    Architecture diagram with three input lanes for the language instruction, wrist and scene cameras, and a 6-axis force-torque sensor with joint currents; each lane passes through its own encoder plus linear projection to the model width, the vision and force tokens form a shared key-value memory, the language and vision hidden states act as queries into a gated cross-attention block inside the pretrained VLM, and the policy emits an action chunk, a target wrench, and impedance gains

    Figure 1: Only the encoders and projections are modality-specific. After projection, the wrench and current tokens are ordinary keys and values, and the zero-initialized gate controls how much of that memory reaches the residual stream. The head deliberately outputs gains and wrenches, not just poses, because a stiff position command in contact is how robots break parts.

    Two practical details decide whether this works on hardware. The first is signal conditioning: a raw wrench includes tool gravity, payload inertia, and thermal bias drift, so the encoder must be fed a gravity-compensated and re-zeroed signal, otherwise the same physical contact produces different tokens after every payload change. Joint current is an even noisier torque proxy, since \tau_j = k_t i_j holds only after subtracting harmonic-drive friction and stiction, which are velocity-dependent and hysteretic; current is therefore best used for coarse collision and jam detection across the whole arm rather than for fine wrench estimation at the tool. The second is bandwidth. Slip, chatter, and impact live in the 100-1000 Hz band, so pooling to 10 Hz destroys exactly the evidence you added the sensor for, which is why many implementations feed short-time spectral features or per-window statistics (peak, RMS, jerk) alongside the mean rather than a naive average.

    Four stacked time plots over 400 milliseconds: the top shows a 1 kHz force-torque channel that jumps to 22 newtons at contact and rings down within about 4 milliseconds to an 8 newton steady value, the second shows camera frames as ticks every 100 milliseconds, the third shows VLA forward passes as 115 millisecond blocks repeating at 5 hertz, and the bottom shows the commanded stiffness as a staircase that only changes when a new policy output lands

    Figure 2: The rate mismatch is the whole design constraint. The impact transient starts and finishes inside a single policy cycle, and the camera may not even sample it, so the VLA can only choose a compliance policy in advance and let the 1 kHz loop execute it. Anything that must react in under 10 ms cannot live in the transformer.

    Mathematical Formulation:
    w_t = (f_x, f_y, f_z, \tau_x, \tau_y, \tau_z)
    \tau_j = k_t i_j - \tau_{f}(\dot q_j)
    U_{ft} = W_{ft}\, \phi_{ft}(w_{t-K+1:t})
    M = [\, U_{vis} ; U_{ft} ; U_{cur} \,]
    C = \mathrm{Attn}(h W_q,\; M W_k,\; M W_v)
    h \leftarrow h + \tanh(\alpha)\, C
    f_{cmd} = K(x_d - x) + D(\dot x_d - \dot x)

    Where:

    • w_t \in \mathbb{R}^{6} is the wrench at time t, with three forces f and three moments \tau expressed in the tool frame after gravity and payload compensation.
    • i_j is the measured current of joint j, k_t the motor torque constant, and \tau_f(\dot q_j) the friction and stiction term that makes current a biased torque estimate.
    • \phi_{ft} is the window encoder over the last K samples and W_{ft} its projection to the backbone width d; U_{ft} is the resulting small set of soft tokens.
    • M is the concatenated key/value memory holding visual, force-torque, and joint-current tokens, and h is the language and vision hidden state that provides queries through W_q.
    • \alpha is the learned scalar gate, initialized at 0 so that \tanh(\alpha) = 0 and the block reduces to the pretrained VLM on the first step.
    • K and D are the commanded stiffness and damping matrices, x_d and \dot x_d the desired pose and velocity, and f_{cmd} the wrench the 1 kHz controller actually applies.

    Rate And Token Budget:
    K = 0.1 \times 1000 = 100
    L_{ft} = 100 / 10 = 10
    t_{vla} \approx 115\ \mathrm{ms}
    t_{contact} \approx 4\ \mathrm{ms}

    A 100 ms window at 1 kHz gives 100 raw samples, pooled to 10 tokens, so about 100 force tokens per second ride alongside thousands of visual tokens. Meanwhile roughly 29 impact transients fit inside one policy forward pass, which is the quantitative reason the fusion is about situational awareness and gain scheduling rather than reflexes. The most common training pathology follows from the same asymmetry: proprioceptive inputs are low-dimensional and almost perfectly predict the next demonstrated action, so behaviour cloning happily learns to regress the previous command from state and stops looking at the camera. That is textbook causal confusion, and the usual defenses are proprioception dropout, delta actions instead of absolute targets, action chunking, and holdout episodes with the object moved.

    Line chart of the share of cross-attention probability mass over normalized task progress for a peg insertion, with vision tokens starting near 0.62 and falling to about 0.30 during the shaded contact and insertion phase, force-torque tokens rising from 0.05 to about 0.56 across that same phase, and joint-current tokens staying below 0.18 throughout, with phase labels for reach, approach, contact plus insert, and retract

    Figure 3: Illustrative attention-mass trace for a peg-insertion policy. During free-space reaching the wrench tokens are near zero and attract almost no mass, and once the peg is inside the hole vision is largely occluded so the wrench becomes the dominant evidence. The shares do not sum to one because language and history tokens hold the remainder.

    PropertyEarly token concat (self-attention)Gated cross-attention adapterHierarchical (force outside the model)
    Where force entersAppended to the input sequence, every layer sees itAs keys and values in an inserted cross-attention blockOnly in the 1 kHz impedance loop, plus a scalar contact flag
    Parameters touchedFull backbone fine-tune in practiceEncoder, projection, and adapter only; backbone can stay frozenNone; the controller is hand-designed
    Robot data neededLargest, since force was absent from pretrainingModerate, the zero-init gate keeps the prior intactSmallest, contact behaviour is not learned
    Contact reaction latencyOne policy cycle, 100-200 msOne policy cycle, 100-200 msAbout 1-2 ms
    Dominant failure modeProprioception shortcut and catastrophic forgetting of language groundingGate saturates near zero and the sensor is silently ignoredCannot express task-dependent compliance or recover from a jam

    Login to view more content
  • DL0155 Crowdsourced Teleoperation Quality

    How do you handle dataset quality variance in crowdsourced teleoperation data when training large VLA policies, for a collection like DROID or Open X-Embodiment?

    Answer

    Crowdsourced teleoperation data is a mixture over operators, rigs, and sessions, not a single distribution. DROID’s 76k trajectories were collected by about 50 operators across 13 institutions, and Open X-Embodiment pools 60 datasets over 22 embodiments, so per-episode quality varies more than the task labels do. The working assumption is that quality is a measured per-episode variable, not a binary success flag, so the first engineering step is a scoring pass that attaches provenance plus cheap kinematic proxies to every episode and stores them as metadata rather than deleting anything. Training then spends that metadata at three separate points: group weights over operator or site during pretraining, a quality token in the conditioning so the model learns the difference between clean and sloppy behaviour, and a short anneal on a curated gold subset that decides what the policy actually imitates at test time. Hard filtering is the last resort, because imitation error compounds as O(\epsilon H^2) and most of that \epsilon comes from states the policy has never visited, which is exactly what the messy tail supplies. Two mechanical fixes matter as much as the curation: percentile-based action normalization so one jerky operator cannot rescale the action space, and an expressive action head over action chunks so contradictory strategies are not averaged into a mean action.

    (1) Quality Is A Variable, Not A Flag: score every episode continuously and keep the score, because a policy trained on a thresholded boolean cannot be re-mixed later without a second scoring pass.
    (2) Cheap Automatic Proxies: action jerk, path-length ratio, idle-time fraction, regrasp and retry count, teleop latency spikes, and VLM-based verification of the success label and the language annotation.
    (3) Provenance Is The Grouping Unit: operator, site, and rig ids define the groups used for reweighting and, critically, for held-out evaluation splits so a strong operator’s style does not leak across train and test.
    (4) Coverage Versus Purity: the sloppy tail carries the recovery states and rare scenes that keep compounding error small, so aggressive filtering can lower success even while raising average demo quality.
    (5) Pretrain Broad, Post-Train Narrow: the data-pyramid recipe used by recent VLA foundation models trains on nearly everything and then anneals on a small, verified, high-quality set.
    (6) Quality-Conditioned Cloning: feed the tier as a token during training and sample at the gold setting at inference, which uses bad data as negative evidence instead of throwing it away.
    (7) Robustness Plumbing: 1st/99th percentile action normalization as in OpenVLA, plus flow-matching or diffusion heads, so outliers and multimodality do not corrupt the regression target.

    Pipeline diagram: three crowdsourced collection sites with per-operator episode counts feed an automatic episode scoring stage using VLM success checks, action jerk, path ratio, idle fraction, regrasps and latency spikes; the scorer assigns gold, silver and bronze tiers; all three tiers feed one training recipe box listing group-DRO pretraining weights, a quality token in the prompt, and a final anneal on the gold tier; the recipe trains a VLA policy that is evaluated on held-out sites, with a feedback arrow returning operator scorecards and re-collection requests to the sites

    Figure 1: The topology is what matters: scoring is a metadata pass, not a delete pass, all three tiers reach the pretraining stage, and only the last stage is restricted to gold. The closing arrow is the part teams forget, since per-operator scorecards turn quality measurement into targeted re-collection rather than a one-time filter.

    The scoring pass should stay cheap enough to run over every episode. Kinematic proxies are computed directly from the recorded action stream: mean squared jerk over the trajectory, the ratio of executed end-effector path length to the straight-line distance, the fraction of timesteps with near-zero commanded velocity, and the number of gripper open/close reversals as a regrasp counter. Semantic proxies need a model: a VLM watches the final frames and votes on whether the stated goal was reached, and a second pass checks that the language annotation matches the video, which catches the common crowdsourcing failure where the instruction and the demonstration disagree. These proxies are then aggregated into one score per episode and, separately, per operator. Reweighting uses the group statistic because per-episode weights are noisy and because the real covariate shift is at the operator and rig level, where calibration offsets, camera mounts, and latency are shared.

    Mathematical Formulation:
    q_j = \sigma(\beta^{\top} \phi(\tau_j))
    \mathcal{L}_g(\theta) = \mathbb{E}_{(o,a) \sim D_g}[\ell(a, \pi_{\theta}(o))]
    \min_{\theta} \max_{w \in \Delta_G} \sum_{g=1}^{G} w_g \mathcal{L}_g(\theta)
    J(\pi^{*}) - J(\hat{\pi}) \leq C \epsilon H^2
    \tilde{a} = 2 (a - q_{01}) / (q_{99} - q_{01}) - 1

    Where:

    • q_j \in (0,1) is the quality score of episode \tau_j, with \phi the proxy feature vector (jerk, path ratio, idle fraction, regrasps, VLM verdict) and \beta fitted on a few hundred human-labelled episodes.
    • \mathcal{L}_g is the loss on group g, where a group is one operator, site, or source dataset, and D_g its observation-action pairs with observation o (images plus instruction plus proprioception) and action chunk a.
    • g \in \{1,\ldots,G\} indexes groups, \Delta_G is the simplex of mixture weights, and the inner maximization is group DRO, which upweights whichever group is currently worst-fit instead of trusting a hand-tuned mixture.
    • \pi_{\theta} is the policy, \ell the per-sample cloning loss, H the rollout horizon, and \epsilon the per-step error under the expert’s state distribution; the H^2 factor is why coverage of off-nominal states is worth more than average demo neatness.
    • q_{01} and q_{99} are the 1st and 99th percentiles of each action dimension over the training mixture, so \tilde{a} \in [-1,1] is a quantile-normalized target that a single spiking operator cannot stretch.

    The trade-off curve is the part that surprises people. Sorting episodes by score and keeping only the top fraction improves the average target the policy regresses onto, but it also removes scenes, lighting conditions, object instances, and above all recovery segments: the moment where an operator overshot, re-approached, and succeeded is precisely the state a deployed policy will find itself in. Empirically the filter-only curve is an inverted U, peaking somewhere around half the data and then falling below the train-on-everything baseline once coverage collapses. Reweighting dominates filtering because it keeps every state in the support while shrinking the gradient contribution of noisy actions, and the gold anneal captures most of the remaining gain at almost no cost since it touches only the final few percent of optimization steps.

    Line chart of real-robot success rate against the fraction of training data retained when keeping the highest-quality episodes first. The hard-filter curve is an inverted U peaking near 55 percent retained and dropping sharply below the baseline at 10 percent retained, while the reweight-plus-gold-anneal curve rises monotonically and is highest when all data is retained. A dash-dotted horizontal line marks the uniform train-on-everything baseline.

    Figure 2: Two different shapes from the same scores. Hard filtering trades coverage for purity and therefore has an interior optimum you must search for, while reweighting plus a gold anneal keeps the full state support and improves monotonically as more data is retained. The gap at the right edge is the cost of deleting data you could have downweighted instead.

    Quality variance also shows up as multimodality, which is a modelling problem rather than a data problem. When two operators route around the same obstacle in opposite directions, the conditional action distribution given the observation is bimodal, and any head trained with a plain mean-squared-error objective converges to \mathbb{E}[a \mid o], the average of the two modes. That average is often an invalid action, so the policy fails on the exact scenes where it had the most data. The fixes are an expressive head (diffusion or flow matching over an action chunk, as in the pi-zero family) which samples a single coherent mode, action chunking so a commitment persists for several timesteps instead of flip-flopping per step, and conditioning on style or operator id when the modes are genuinely operator-specific. This is also why “smooth” should never be the only quality criterion: a smooth demonstration that solves the task differently from the rest of the corpus still injects a competing mode.

    Two panels sharing the same scene with a start point, a goal, and a rectangular obstacle between them. Left panel: one operator's demonstrations arc above the obstacle, another operator's arc below, and a red dashed straight line at the midline shows that the mean-squared-error head predicts the average of both modes and drives into the obstacle. Right panel: a flow-matching or diffusion head produces three sampled trajectories above and three below, each committing to a single side and clearing the obstacle.

    Figure 3: Mixed-operator data is multimodal in action space. A unimodal regression head collapses two valid strategies onto their mean, which here is a straight line through the obstacle, while a sampling head over action chunks commits to one mode per rollout. No amount of filtering fixes this if both strategies are high quality.

    PropertyHard filteringGroup reweighting + gold annealQuality-conditioned cloning
    MechanismDrop every episode below a score threshold before trainingPer-group loss weights during pretraining, then a short fine-tune on the gold tierTier token in the conditioning; sample at the gold setting at inference
    Effect on coverageShrinks the state support, removes rare scenes and recovery segmentsFull support retained; only the gradient share of noisy groups shrinksFull support retained; bad data acts as contrastive evidence
    Extra machineryOne threshold, tuned by expensive real-robot sweepsGroup ids, a weight optimizer such as group DRO, a second training stageScore discretization, a token in the prompt, calibrated tier boundaries
    When it winsLabels are corrupt rather than merely sloppy, or the episode is unsafe to imitate at allLarge heterogeneous corpora where coverage is the scarce resourceScores are reliable and the sloppy modes are still physically valid
    Main failure modeProxy measures task difficulty, so filtering silently deletes the hard tasksWeights overfit one noisy group; the anneal overfits and forgets the broad priorMiscalibrated tiers make the gold token meaningless, and the policy ignores it

    Login to view more content
  • DL0154 Synthetic Data and Isaac Sim

    How do synthetic data generators such as Isaac Sim and Omniverse produce realistic tactile, force sensor, and RGB-D depth outputs for VLA pre-training?

    Answer

    Nothing in the stack emits a realistic sensor reading directly. Each modality comes out of a different subsystem with its own fidelity ceiling, and realism is added afterwards as an explicit sensor model. RGB and depth are produced by the RTX renderer and read back through Omniverse Replicator annotators, where distance_to_image_plane returns per-pixel metric depth with no holes, no quantization, and no stereo shadows. Joint and contact forces are read out of the PhysX 5 reduced-coordinate articulation solver, so a “measured” wrist force is really a constraint impulse divided by the physics timestep. Tactile is not a first-class sensor at all: it is reconstructed from the signed-distance penetration between a gel collider and the object, then either rendered as a GelSight-style image or collapsed into a taxel normal-force map. Everything the simulator hands you is exact, and the actual engineering is deciding how to break it so a VLA trained on it survives a real RealSense and a real six-axis load cell.

    (1) Ground Truth First, Noise Second: the renderer and the solver give error-free signals, so every realism claim rests on a post-processing layer that injects noise, quantization, dropout, bandwidth limits, and latency.
    (2) RGB-D Is A Rendering Plus Annotator Problem: PBR materials and HDRI domes handle appearance, while tiled rendering makes many cameras affordable, but no renderer reproduces stereo matching failure on specular and transparent surfaces unless you model it.
    (3) Forces Are Solver Readouts: get_measured_joint_forces and the contact reporter expose impulses at the physics rate, so magnitudes depend on timestep, substeps, solver iterations, and contact offset rather than on any sensor.
    (4) Tactile Is Reconstructed Geometry: the penetration field against the object SDF drives both the rendered gel image and the taxel forces, with shear obtained by clipping tangential displacement to the Coulomb friction cone.
    (5) Physics Calibration Sets Force Fidelity: friction, mass, inertia, restitution, and SDF colliders instead of convex hulls matter more to contact realism than any amount of visual polish.
    (6) Scale Comes From Trajectories, Not Pixels: Replicator randomizes lighting, materials, poses, and per-environment physics while MimicGen-style augmentation turns a few dozen human demos into hundreds of thousands of contact-rich episodes.

    Pipeline diagram in which a USD scene feeds both a PhysX 5 GPU solver and the RTX renderer, which in turn feed three sensor lanes for joint and contact forces, a tactile penetration field, and RGB-D annotators, all passing through a shared sensor realism layer of noise, quantization, invalid masks, filtering and latency before a dataset writer and VLA pre-training

    Figure 1: Three sensor lanes, one scene graph. Only the RGB-D lane is a genuine sensor simulation; the force lane is a solver readout and the tactile lane is reconstructed from geometry, which is why the shared realism layer does most of the sim-to-real work.

    Depth is where naive pipelines fail first. The annotator gives exact metric depth, so a policy trained on it learns to trust razor-sharp object boundaries, reads valid depth off glass and polished steel, and never sees the occlusion shadow that a stereo baseline creates on the left edge of every object. A usable depth channel is therefore built by emulating the device: convert depth to disparity, quantize it, add matching noise that grows as z^2, invalidate pixels where the simulated left and right views disagree or where the material is specular or transparent, quantize to the 1 mm uint16 grid, and finally apply the frame delay and rolling-shutter smear of the real driver. Two annotator traps show up in review: distance_to_camera returns Euclidean range while distance_to_image_plane returns the z component that RGB-D APIs expect, and a policy trained on the wrong one develops a radial bias that grows toward the image corners.

    Line chart of injected axial depth noise in millimetres versus range in metres for stereo baselines of 50, 95 and 120 millimetres, all growing quadratically with range, plus a flat zero-error line for the simulator raw depth and a dash-dotted line marking the one millimetre uint16 quantization step

    Figure 2: Depth realism is arithmetic, not rendering. With f = 600 px and \sigma_d = 0.1 px, a 50 mm baseline is submillimeter at 0.5 m and roughly 13 mm at 2 m, while the simulator’s raw depth sits on the flat zero-error line at every range.

    Mathematical Formulation:
    z = \frac{f b}{d}
    \sigma_z = \frac{z^2}{f b}\,\sigma_d
    \tilde z = q\,\mathrm{round}(z/q) + \eta
    F_{\mathrm{meas}} = \lambda_c / \Delta t
    d(u,v) = \max(0,\, -\phi(x_{uv}))
    \|f_t\| \leq \mu f_n

    Where:

    • z is metric depth, f the focal length in pixels, b the stereo baseline, and d the disparity in pixels.
    • \sigma_d is subpixel matching noise, typically 0.05 to 0.2 px, and the z^2 factor is why one camera is millimeter-accurate up close and centimeter-accurate at 2 m.
    • q is the depth quantization step (1 mm for uint16 output) and \eta the residual additive noise; a separate invalid mask zeroes stereo-shadow, specular, and transparent pixels.
    • \lambda_c is the constraint impulse the solver applied at a joint or contact and \Delta t the physics step, so the reported force scales as 1/\Delta t and is rate and solver dependent rather than physical.
    • \phi is the object’s signed distance function evaluated at gel sample x_{uv}, and d(u,v) is the penetration depth field on the tactile grid that drives both the gel image and the taxel normal force.
    • f_n and f_t are normal and tangential contact force with friction coefficient \mu; marker flow exists only inside the cone, and slip appears when the bound is reached.

    On the force side the honest framing is that PhysX gives you a well-behaved dynamics readout, not a load cell. A stiff impact resolved in one 8.3 ms step at 120 Hz appears as a single enormous impulse, whereas a real 1 kHz sensor reports a damped ringdown shaped by its own mechanical resonance plus a slowly drifting bias and a few percent of cross-axis coupling. The practical recipe is more substeps or a smaller \Delta t for contact-rich phases, a contact history buffer in the sensor wrapper, then a low-pass filter to the real sensor bandwidth followed by injected bias, drift, and colored noise. Tactile needs the same discipline plus a calibration step: the elastomer in simulation is rigid geometry, so penetration depth substitutes for deformation, and the mapping from d(u,v) to gel pixel intensity has to be fitted against real presses on known indenters. Hysteresis, adhesion, and creep are simply absent, which bounds how far a purely simulated tactile channel can carry a slip-detection policy.

    Two panels: a cross-section showing an object surface pressing 1.2 millimetres into a 3 millimetre gel layer with the penetration region shaded and the contact radius marked, and a heatmap of the resulting penetration depth field over a 12 by 12 millimetre tactile grid with radial shear arrows and a dashed contact boundary

    Figure 3: Tactile output is reconstructed, not sensed. The penetration field d(u,v) = \max(0, -\phi) against the object SDF supplies both the rendered gel image and the taxel normal-force map, while tangential flow is only valid inside \|f_t\| \leq \mu f_n.

    PropertyRGB-DJoint and contact forceTactile
    Source subsystemRTX renderer plus Replicator annotatorsPhysX 5 articulation and contact solverSDF penetration query plus a gel renderer (TacSL, TACTO)
    Native outputExact metric depth, segmentation, normals, no holes6D joint reaction force and net contact force at the physics ratePenetration depth field on the gel grid, plus a shear field
    Fidelity ceilingAsset and light-transport quality; stereo and ToF failure modes are not renderedFriction, mass, inertia, solver iterations, contact and rest offsetGel treated as rigid geometry, so hysteresis, adhesion and creep are missing
    Mandatory post-processingDisparity quantization, z^2 noise, invalid mask, blur, frame latencyLow-pass to sensor bandwidth, bias drift, cross-axis coupling, spike clippingIllumination and marker calibration on real presses, Coulomb-clipped shear
    Real data still neededLittle for RGB, moderate for depth on shiny and transparent scenesSmall for quasi-static tasks, large for impacts and insertionLarge: a real fine-tuning set of presses, rolls and slips is usually unavoidable

    Login to view more content
  • DL0153 Sim-to-Real Transfer

    What is sim-to-real transfer in robot learning, and how do domain randomization, system identification, and visual domain adaptation each close a different part of the reality gap?

    Answer

    Sim-to-real transfer is training a control policy in a physics simulator, where data is fast, safe, and infinitely resettable, and then deploying it on hardware that obeys different physics and produces different pixels. The reality gap is the mismatch between the simulated MDP and the real one, and it decomposes into at least three channels: dynamics parameters that are simply mistuned (mass, friction, joint damping, motor gains), unmodeled effects that the simulator has no term for (cable drag, gear backlash, control latency, deformable contact), and the observation gap between rendered and captured images. The three classic techniques are not competitors; each attacks a different channel. Domain randomization trains one policy over a distribution of simulators so the real robot behaves like just another sample from that distribution, system identification measures the real robot and moves the simulator’s parameters onto it, and visual domain adaptation leaves dynamics alone and instead makes sim and real images look identical to the encoder. Production pipelines for legged locomotion and dexterous manipulation compose them: identify what you can measure, randomize what you cannot, adapt the residual online with a history-conditioned policy.

    (1) The Gap Is Not One Number: dynamics, unmodeled effects, and observations fail independently, so a policy can transfer perfectly in torque space and still collapse because the real camera has motion blur.
    (2) Domain Randomization Widens The Simulator: sampling \xi \sim p(\xi) each episode buys robustness without any real data, provided the true parameters lie inside the support.
    (3) System Identification Shrinks The Gap Itself: fitting \xi to logged real trajectories gives a sharper simulator and a higher-performance policy, but only for effects the simulator can represent.
    (4) Visual Domain Adaptation Works In Pixel Space: feature alignment, randomized-to-canonical translation, or image-to-image GANs remove appearance shift that no amount of physics tuning touches.
    (5) Support Coverage Is The Binding Constraint: if \xi_{\mathrm{real}} falls outside the randomization support, the policy has literally never trained on the real robot’s physics and no amount of averaging helps.
    (6) Online Adaptation Recovers The Lost Performance: conditioning on a short history of states and actions lets the policy infer the latent parameters at run time, which is why teacher-student distillation and rapid motor adaptation beat blind robustness.

    Two-panel conceptual diagram. Left panel shows a dynamics parameter space with axes friction coefficient and payload mass, a blue dot for the simulator nominal parameters, a red star for the real robot parameters, a large shaded rectangle marking the randomization support that contains the star, and a dashed arrow from the nominal point to the star labeled system identification. Right panel shows a visual feature space with a tight cluster of sim render points and a separate cluster of real camera image points, a large tilted ellipse marking the spread produced by visual randomization that envelops both clusters, and a curved arrow mapping the real cluster onto the sim cluster labeled domain adaptation.

    Figure 1: The same gap, two spaces and two directions of correction. In parameter space randomization inflates the simulator’s support until it contains the real robot, while system identification translates the nominal point onto it. In feature space randomization spreads the sim distribution until it envelops the real look, while adaptation pulls real observations back onto the canonical sim appearance.

    The mechanisms differ in what they need and what they cost. Domain randomization needs zero real data: you pick ranges for mass, friction, terrain roughness, motor strength, sensor noise, latency, and texture, then resample every episode so the policy cannot memorize one dynamics model. Its price is conservatism, because a memoryless policy maximizing expected return over a wide p(\xi) converges to behavior that is safe for the average simulator and optimal for none, which is why Automatic Domain Randomization grows the ranges only as fast as the policy can absorb them. System identification runs in the opposite direction: excite the hardware, log (s_t, a_t, s_{t+1}), and minimize prediction residuals to recover \hat{\xi}. It buys back performance and shrinks the randomization ranges you still need, but it can only fit parameters the simulator exposes, so backlash or a compliant tendon that has no corresponding term stays invisible no matter how good the fit is. Visual domain adaptation is orthogonal to both: RCAN-style translation maps heavily randomized or real images to one canonical rendering before the policy sees them, GraspGAN-style translation pushes sim images toward realism, and feature-level alignment penalizes the discrepancy between sim and real encoder activations. The standard modern recipe is a pipeline: identify → randomize the residual uncertainty → train a privileged teacher with access to \xi → distill into a student that reads only onboard history → deploy.

    Mathematical Formulation:
    \Delta(\pi) = J_{\mathrm{real}}(\pi) - J_{\mathrm{sim}}(\pi)
    \pi_{\mathrm{DR}} = \arg\max_{\pi} E_{\xi \sim p(\xi)} [ J_{\xi}(\pi) ]
    \xi_{\mathrm{real}} \in \mathrm{supp}(p(\xi))
    \hat{\xi} = \arg\min_{\xi} \sum_{t=1}^{T} \| e_t(\xi) \|^2
    e_t(\xi) = s_{t+1} - f_{\xi}(s_t, a_t)
    \min_{g} \; d( g(o_{\mathrm{sim}}), g(o_{\mathrm{real}}) )

    Where:

    • J_{\mathrm{real}} and J_{\mathrm{sim}} are the expected returns of policy \pi on hardware and in simulation, and \Delta(\pi) is the reality gap measured in task performance rather than in physics units.
    • \xi is the vector of simulator parameters (masses, friction coefficients, motor gains, latencies, texture and lighting seeds) and J_{\xi} is the return in the simulator instantiated with \xi.
    • p(\xi) is the randomization distribution; the support condition is the precondition for transfer, since a policy trained on p(\xi) has no guarantee at all for parameters outside \mathrm{supp}(p(\xi)).
    • \hat{\xi} is the identified parameter estimate, f_{\xi} the simulator’s one-step transition model, and e_t the one-step prediction residual against a logged real transition from state s_t under action a_t.
    • t \in \{1, \ldots, T\} indexes the real excitation trajectory; residual that cannot be driven to zero by any \xi is unmodeled physics, and it is exactly what must be randomized or adapted away instead.
    • g is the visual encoder, o_{\mathrm{sim}} and o_{\mathrm{real}} are observations from the two domains, and d is a distribution distance such as an adversarial discriminator loss or a maximum mean discrepancy.
    Line chart of task success rate versus randomization half-width as a fraction of the nominal parameter value. The sim-domain success curve starts near 0.97 at zero width and decays gently to about 0.73 at full width. The real-world success curve starts near zero, rises steeply once the support begins to contain the true parameters around a width of 0.3, peaks near 0.89 around 0.45, then declines to about 0.39 at full width. A dotted vertical line marks where the real parameter enters the support and a shaded band marks the practical operating range.

    Figure 2: Randomization width has an inverted-U effect on real-world success while sim success decays monotonically, so sim reward is an actively misleading model-selection signal. Too narrow and \xi_{\mathrm{real}} sits outside the support; too wide and the policy averages over incompatible dynamics. System identification moves the useful band left by removing uncertainty you no longer need to cover.

    PropertyDomain randomizationSystem identificationVisual domain adaptation
    Gap channel it closesUnknown dynamics and appearance, covered by breadthMistuned but representable dynamics parametersObservation shift between rendered and captured images
    Real data requiredNone, only sensible rangesExcitation trajectories on the target robotUnlabeled real images, no reward or actions needed
    Main costSample complexity plus a conservative policyHardware time, and it must be redone per unit and as parts wearA second generative or adversarial model to train and maintain
    Dominant failure modeSupport misses the true parameters, or breadth destroys performanceOverfits to one robot and cannot fit unmodeled effectsTranslation hallucinates or drops task-critical detail; dynamics untouched
    Best fitContact-rich locomotion and manipulation across a fleetHigh-precision tasks on one well-instrumented platformImage-based grasping and navigation with cheap renderers

    Login to view more content