What is Deformable Attention and how does it reduce computational complexity for object detection tasks?
Answer
Deformable Attention is a sparse attention mechanism that learns dynamic sampling locations instead of attending to all spatial positions uniformly. It uses learned 2D offsets from reference points to sample only the most relevant features, reducing complexity from  to
to  where K is a small constant (typically 4). This makes it ideal for high-resolution feature maps in object detection where full attention is computationally prohibitive — for a 1024×1024 feature map, standard attention requires ~1M operations per head while deformable attention needs only ~4K.
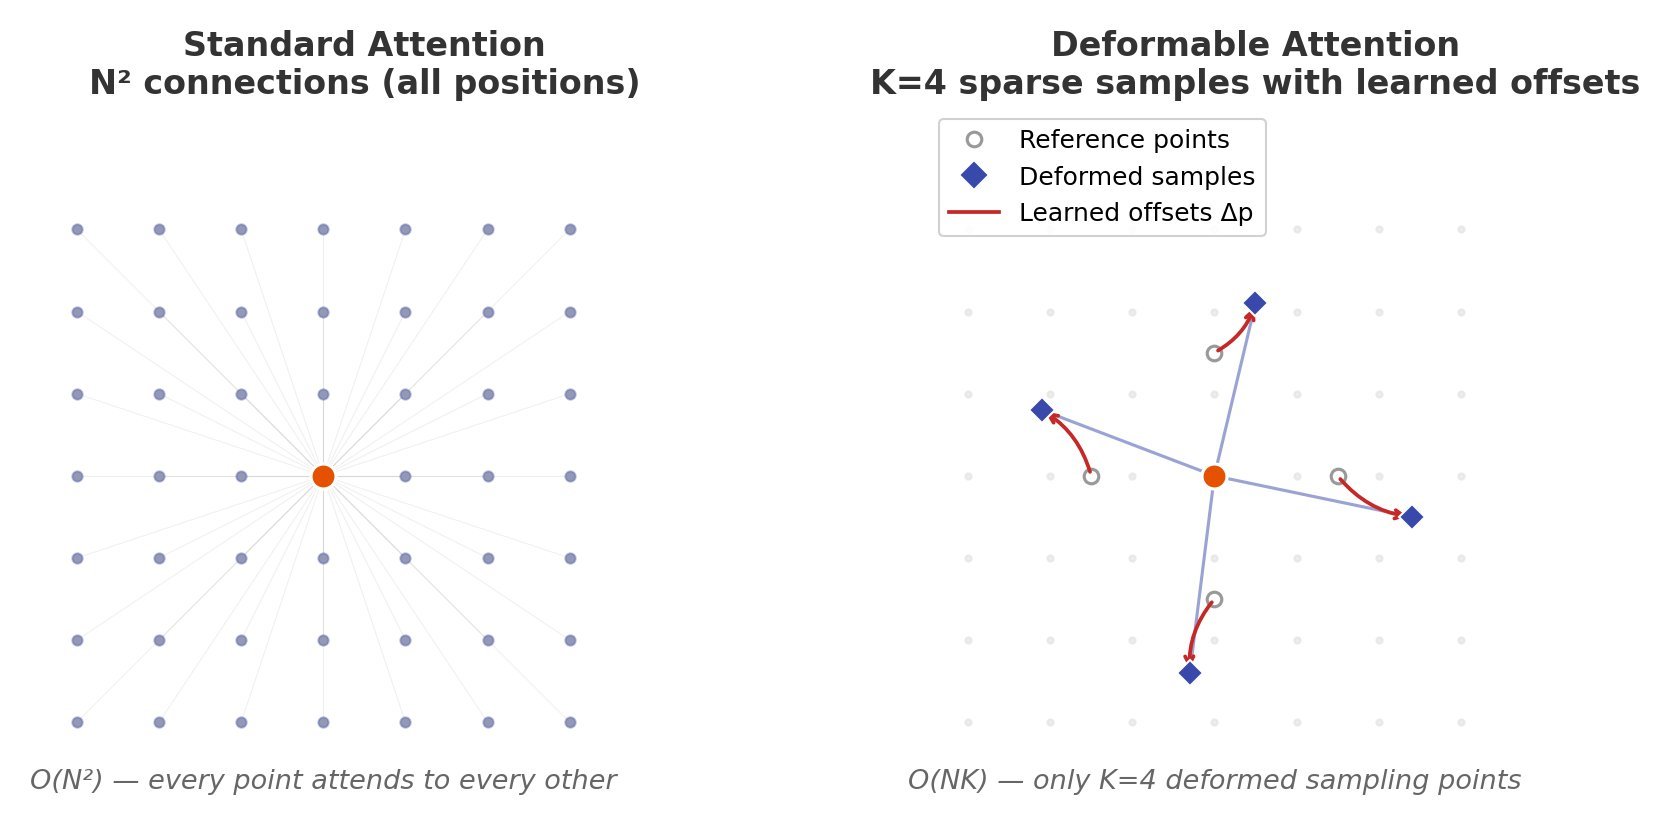
Figure 1: Deformable attention learns K=4 sampling offsets per query point instead of dense N×N attention
(1) Sparse Sampling: Instead of computing attention over all  positions, deformable attention samples only K reference points per query, typically K=4 or 8, reducing the key-value set from N to K.
(2) Learned Offsets: The model predicts  offsets from each reference point
  using a lightweight linear layer on query features, requiring only
  additional computation where C is channel dimension.
(3) Bilinear Interpolation: When offsets point to non-integer locations, bilinear interpolation computes feature values from the 4 nearest pixels, enabling sub-pixel precision sampling without modifying the feature map.

Figure 2: Complexity comparison shows O(NK) grows linearly while O(N²) becomes prohibitive for large feature maps
Mathematical Formulation:
![y(p) = \sum_{m=1}^{M} W_m \left[ \sum_{k=1}^{K} A_{mk} \cdot W_m' x(p + p_k + \Delta p_{mk}) \right]](https://s0.wp.com/latex.php?latex=y%28p%29+%3D+%5Csum_%7Bm%3D1%7D%5E%7BM%7D+W_m+%5Cleft%5B+%5Csum_%7Bk%3D1%7D%5E%7BK%7D+A_%7Bmk%7D+%5Ccdot+W_m%27+x%28p+%2B+p_k+%2B+%5CDelta+p_%7Bmk%7D%29+%5Cright%5D&bg=ffffff&fg=000&s=3&c=20201002)
Where:
 is the reference position (query location on the feature map)
 is the number of attention heads
 is the number of sampled keys per head (typically 4)
- are fixed reference offsets (uniformly initialized)
 are learned deformable offsets (2D, predicted per head per key)
 is the attention weight (normalized, not from softmax over all positions)
 are projection matrices for each head
 is the reference position (query location on the feature map)
 is the number of attention heads
 is the number of sampled keys per head (typically 4)
 are fixed reference offsets (uniformly initialized)
 are learned deformable offsets (2D, predicted per head per key)
 is the attention weight (normalized, not from softmax over all positions)
 are projection matrices for each head
The offsets are predicted by a linear projection from query features:  , where
  . The attention weights
  are computed via a separate softmax over only K elements, not the full N positions. In Deformable DETR, multi-scale deformable attention extends this to sample across multiple feature map resolutions simultaneously, enabling the model to capture both small and large objects efficiently.

 is multiplied by a sigmoid gate
  where
where  is a head-specific projection.
![[0, 1]](https://s0.wp.com/latex.php?latex=%5B0%2C+1%5D&bg=ffffff&fg=000&s=2&c=20201002) , and empirical measurements show mean gate activation of ~0.116, meaning most heads are heavily suppressed — introducing beneficial sparsity without hard pruning.
, and empirical measurements show mean gate activation of ~0.116, meaning most heads are heavily suppressed — introducing beneficial sparsity without hard pruning.


 is the output of the
  -th attention head
![g_i \in [0, 1]](https://s0.wp.com/latex.php?latex=+g_i+%5Cin+%5B0%2C+1%5D+&bg=ffffff&fg=000&s=2&c=20201002) is the head-specific gate score
is the head-specific gate score is a learned projection from query to scalar gate
 is the sigmoid function
 denotes element-wise multiplication
 is the standard output projection
 adds only
  parameters per head — a negligible overhead of ~0.1% of total model parameters — yet significantly improves long-context performance. On the RULER benchmark at 128K context length, gated attention improves needle-in-haystack retrieval accuracy from ~72% to ~94% compared to standard attention.
 represents the absolute position of the token in the sequence.
  represents the base frequency/rotation angle.
  represent the components of the embedding vector.

 represents the i-th model weight
 controls the strength of sparsity
 is the neuron input.
 to reveal more information about class similarities:
 : Raw score (logit) for the i-th class.
 : Temperature parameter (>0) used to soften the probabilities. Higher

 to suppress easy-example gradients and focus learning on hard examples, making it preferable when many easy negatives overwhelm training but requiring careful tuning to avoid amplifying label noise.
 is the model probability for the ground-truth class;
 is the per-class weight for class t.
 is the focusing parameter that down-weights easy examples.

 →
→  ) before reducing it back?
 ) to enhance the model’s ability to learn complex, non-linear feature interactions, then reduces it back to maintain compatibility with other layers. This design acts as a bottleneck, balancing expressiveness and efficiency, and has been empirically shown to boost performance in large-scale models.
 allows the FFN to capture richer nonlinear transformations.
 is the input vector.
 expands the dimension.
 projects back down.


 represents the query vector for the ith attention head.
 and
and  represent the single, shared key and value vectors used by all heads.
 is the dimension of the key vectors.
 , hidden dimension =
  , number of heads =
  .
. is projected into queries, keys, and values.
 (for all 3 matrices).


 = raw score for position

 applied to values
  :
:


 , the dominant term is:
 .
.