How to select K in K-Means?
Answer
To select the optimal number of clusters  in K-Means, use the visual plot like the elbow method, quantitative metrics like the silhouette score, or statistical methods like the gap statistic. These help balance model fit and generalization without overfitting.
Elbow Method:
(1) Plot the within-cluster sum of squares (WCSS) vs. .
(2) Choose the “elbow” point where the rate of improvement slows.
WCSS can be calculated using the following equation:
Where: is cluster
  ,
,  is its centroid.
Here is one plot example to demonstrate the location of the elbow point.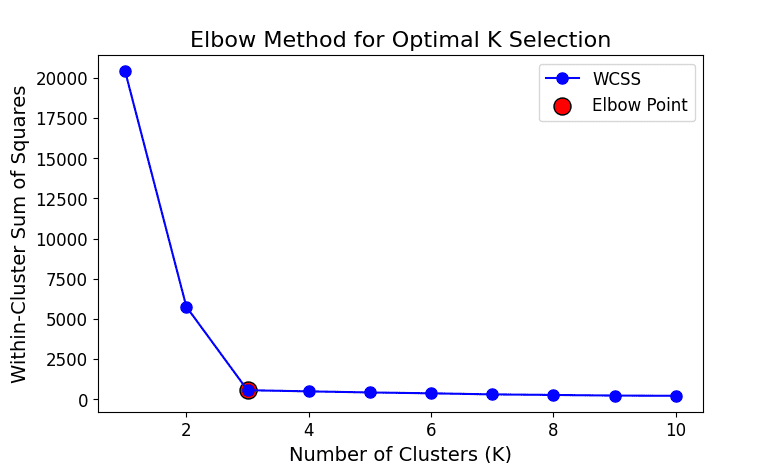
Silhouette Score:
The silhouette score measures how well each point lies within its cluster. It ranges from -1 (wrong clustering) to 1 (well-clustered).
(1) Calculate the average silhouette score for different values.
(2) Choose the that yields the highest average silhouette score.
Silhouette coefficient for point  can be calculated by the following equation.
Where: = intra-cluster distance,
 = nearest-cluster distance.
Gap Statistic:
(1) Compares clustering against a random reference distribution.
(2) Choose that maximizes the gap between observed and expected WCSS.
Leave a Reply