Author: admin

  • DL0057 2D VS 3D Convolutions

    What is the difference between 2D and 3D convolutions, and when would you use each?

    Answer

    A 2D convolution slides a kernel across height and width, while aggregating all input channels at each spatial location. A 3D convolution slides across depth or time as well as height and width, so it learns joint spatiotemporal or volumetric features. Use 2D convolution for ordinary images, per-frame video processing, or slice-wise analysis when cross-slice context is unnecessary. Use 3D convolution for videos, CT/MRI volumes, or occupancy grids when local relationships along the third axis carry essential information and the additional memory and compute are affordable.
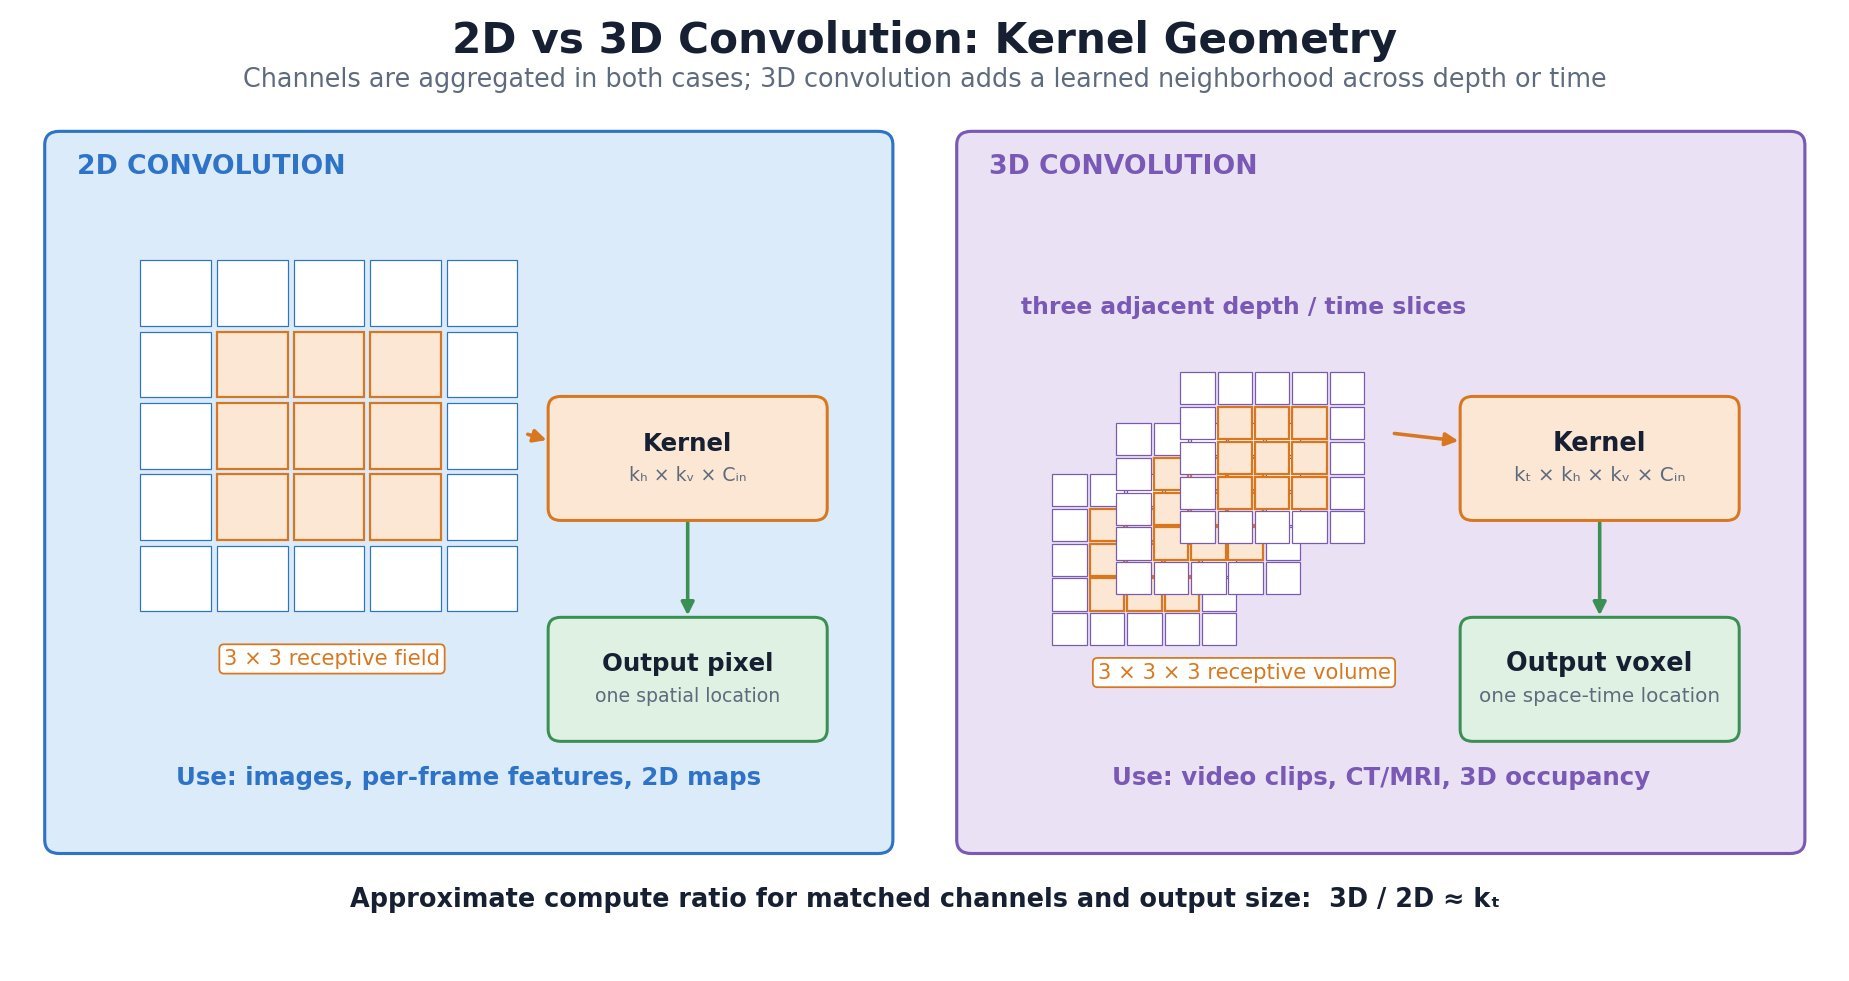
    Side-by-side 2D image kernel and 3D spatiotemporal kernel receptive fields.

    Figure 1: Kernel geometry and output formation for 2D spatial convolution and 3D spatiotemporal convolution.

    (1) Kernel Geometry: A 2D kernel has spatial extent k_h\times k_w; a 3D kernel adds k_d and jointly traverses depth or time.
    (2) Data Semantics: The third axis should represent an ordered neighborhood such as adjacent frames or slices, not an unordered feature channel.
    (3) Trade-off: 3D convolution captures motion or volumetric continuity directly but costs roughly k_d times more than a comparable 2D layer and stores larger activation volumes.

    Mathematical Formulation:
    Y_{o,d,h,w}=\sum_{c=1}^{C_{in}}\sum_{\delta_d,\delta_h,\delta_w}K_{o,c,\delta_d,\delta_h,\delta_w}X_{c,d+\delta_d,h+\delta_h,w+\delta_w}

    Where:

    • X and Y are the input and output tensors, while K is the learned 3D convolution kernel.
    • o indexes output channels and c\in\{1,\ldots,C_{in}\} indexes input channels.
    • d,h,w index output depth/time, height, and width; \delta_d,\delta_h,\delta_w range over the kernel support along those axes.
    • For a 2D convolution, d and \delta_d are removed, leaving only spatial indices h,w; stride, padding, and dilation modify each active index mapping.
    Decision flowchart for selecting 2D, 3D, or factorized convolution.

    Figure 2: Selection guide based on third-axis semantics, required context, resource budget, and deployment constraints.


    Login to view more content
  • DL0056 FlashAttention

    Explain FlashAttention. Why can it compute exact attention faster while using less memory?

    Answer

    FlashAttention is an exact, IO-aware implementation of scaled dot-product attention. Instead of materializing the full N\times N score and probability matrices in high-bandwidth memory (HBM), it loads blocks of Q, K, and V into fast on-chip SRAM, computes attention block by block, and maintains online softmax statistics. Tiling reduces expensive HBM reads and writes, while recomputation during the backward pass can be cheaper than storing large intermediates. The mathematical result matches standard attention up to normal floating-point differences; the speedup comes from changing the execution schedule, not from approximating attention.
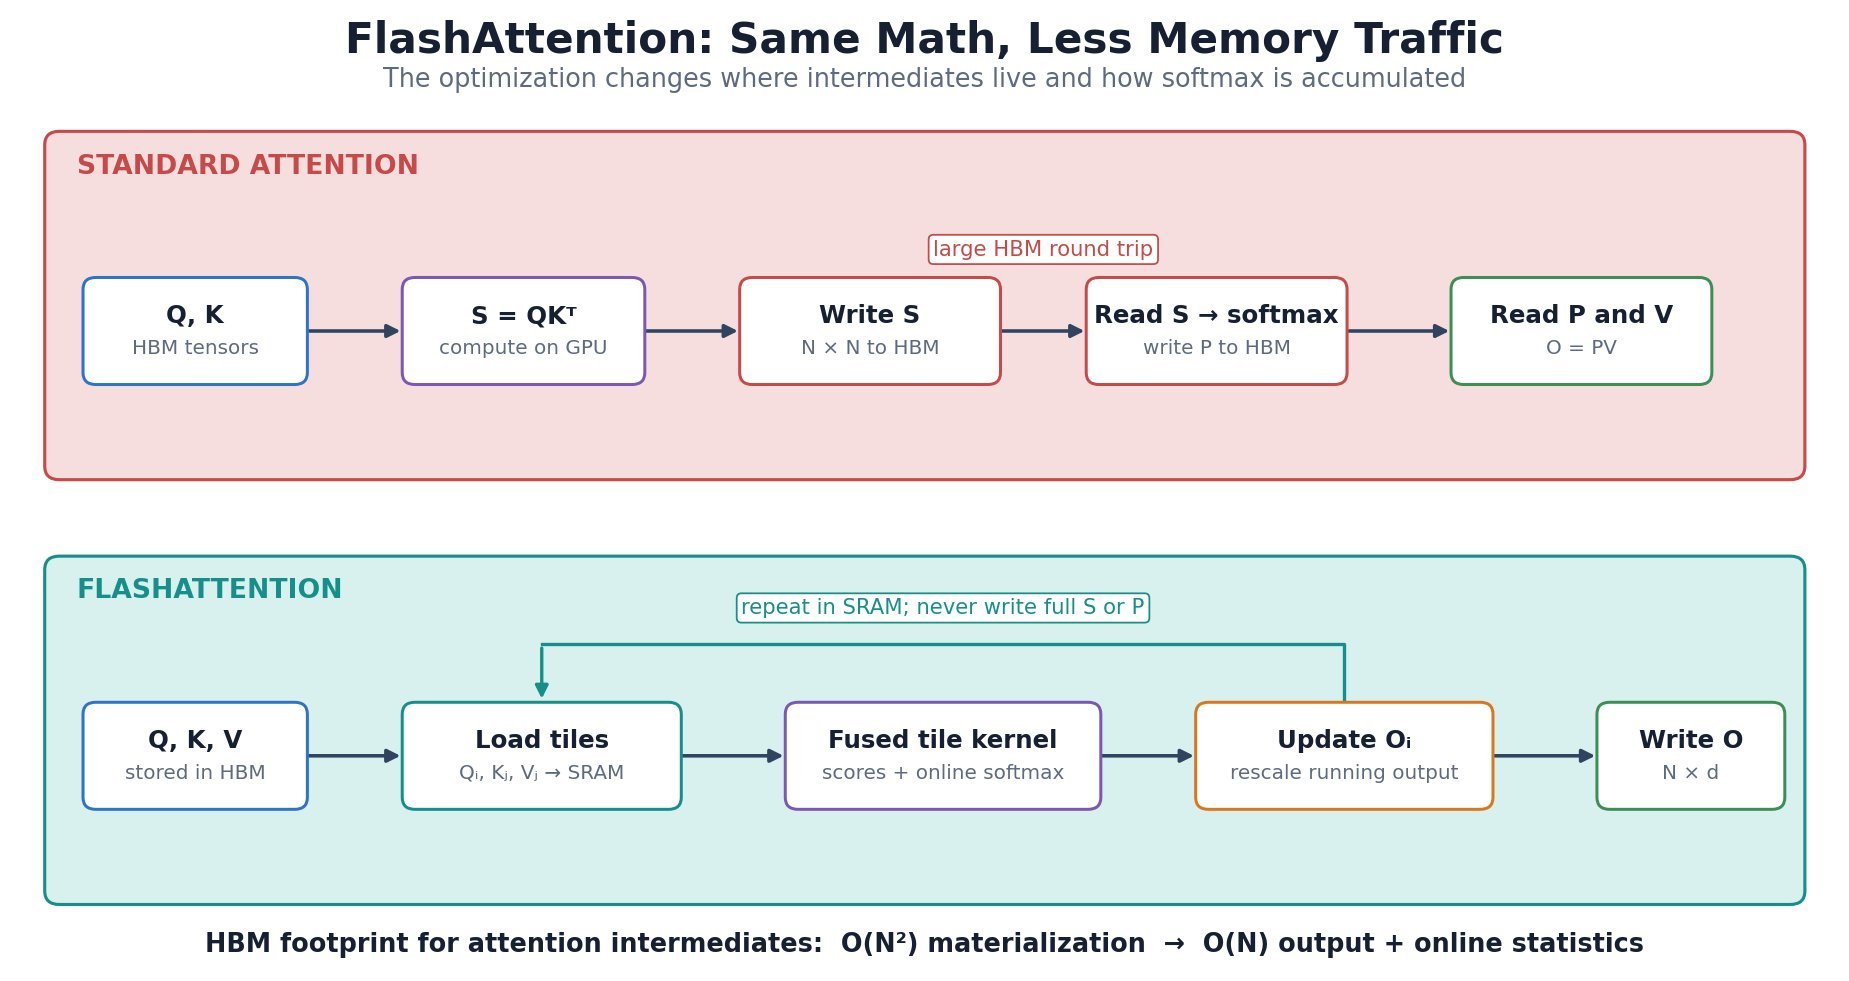
    Comparison of standard attention and FlashAttention data movement through HBM and SRAM.

    Figure 1: IO comparison showing why avoiding N×N intermediate writes makes FlashAttention faster and more memory efficient.

    (1) IO Awareness: The kernel is organized around the GPU memory hierarchy so most score computation and softmax updates happen in SRAM.
    (2) Online Softmax: A running row maximum and normalization sum allow each K,V tile to update the output without retaining previous score blocks.
    (3) Exact Result: All query-key interactions are evaluated; causal masking, dropout, and backward gradients are fused into specialized kernels rather than approximated.

    Mathematical Formulation:
    m_i^{(t)}=\max\!\left(m_i^{(t-1)},\max_j S_{ij}^{(t)}\right)
    \ell_i^{(t)}=e^{m_i^{(t-1)}-m_i^{(t)}}\ell_i^{(t-1)}+\sum_j e^{S_{ij}^{(t)}-m_i^{(t)}}

    Where:

    • t indexes key/value tiles, i indexes a query row, and j indexes keys inside tile t.
    • S_{ij}^{(t)}=Q_iK_j^T/\sqrt d is the scaled score between query row Q_i and key row K_j, with head width d.
    • m_i^{(t)} is the running row maximum after tile t, initialized with m_i^{(0)}=-\infty.
    • \ell_i^{(t)} is the running softmax denominator, initialized with \ell_i^{(0)}=0; the exponential factors rescale earlier partial sums when the maximum changes.
    FlashAttention tiled online-softmax flowchart for one query block.

    Figure 2: Blockwise FlashAttention loop with running maximum, normalization, output rescaling, and final HBM write.


    Login to view more content
  • DL0055 Vision Transformer

    Explain the Vision Transformer (ViT). How does it convert an image into a class prediction?

    Answer

    A Vision Transformer converts an image into a sequence of fixed-size patch tokens and processes them with a Transformer encoder. A learned class token is prepended, positional embeddings preserve patch order, and global self-attention lets every patch exchange information with every other patch. After the encoder stack, the class-token representation is passed to a prediction head. Compared with a CNN, a ViT has weaker built-in locality and translation bias, but it can model long-range interactions directly and scales effectively with data and compute.

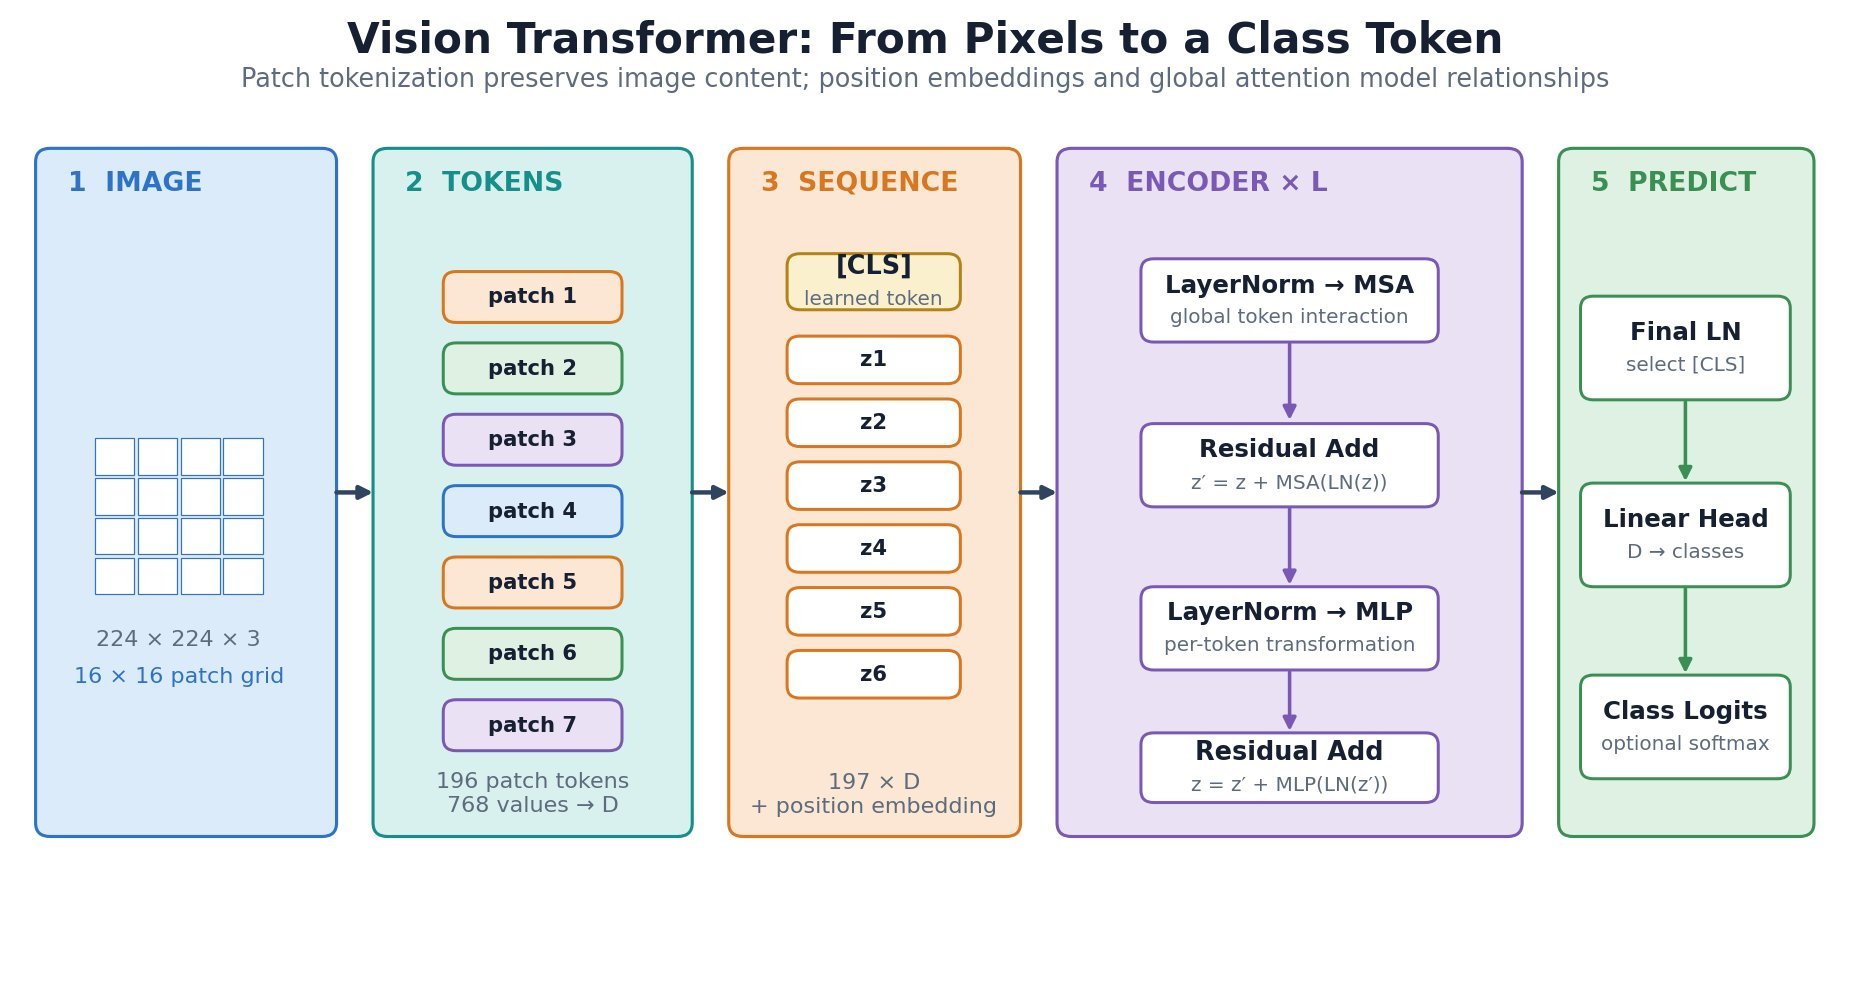
    Vision Transformer architecture from image patchification through token encoding and classification.

    Figure 1: ViT architecture with tensor shapes, patch tokenization, the Transformer encoder stack, and the classification path.

    (1) Tokenization: An image of shape H\times W\times C is divided into N=(H/P)(W/P) non-overlapping P\times P patches; each flattened patch is projected to width D.
    (2) Global Context: Multi-head self-attention mixes information across all patch positions, while residual connections and MLP sublayers refine each token.
    (3) Classification: A learned [CLS] token aggregates evidence across the encoder stack; its final state is normalized and mapped to class logits.

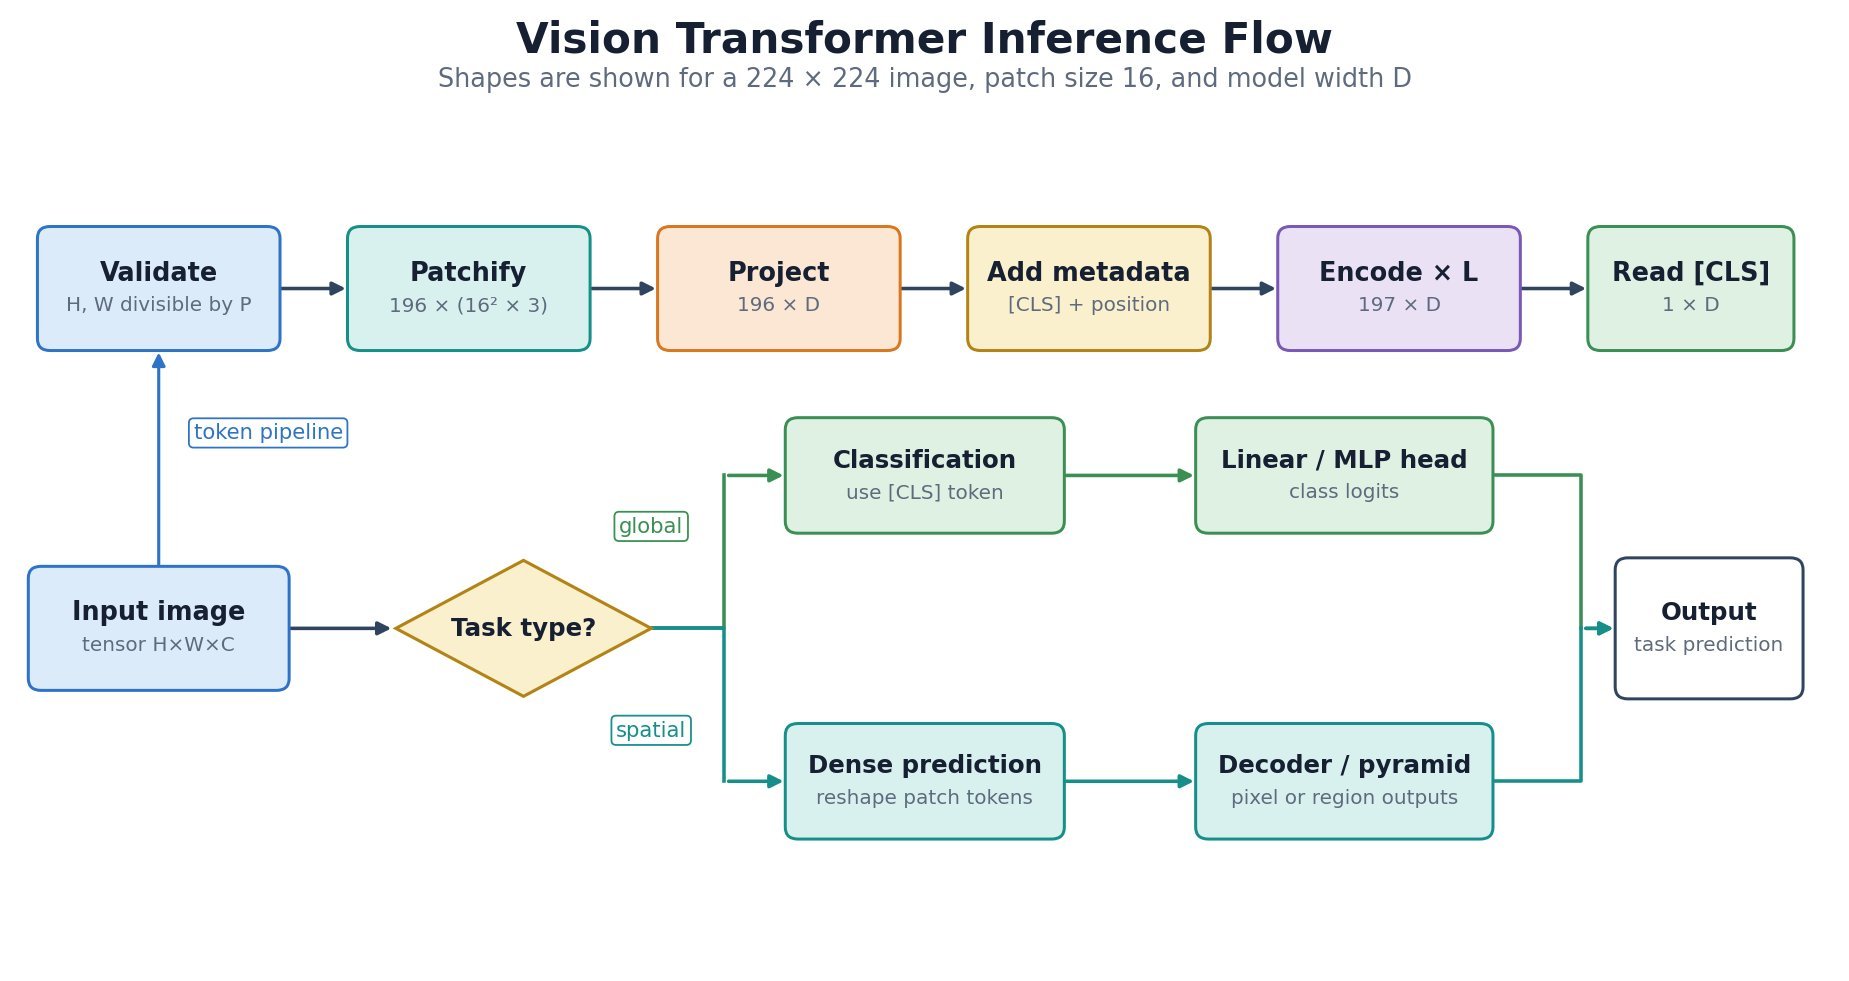
    Vision Transformer inference flowchart showing the ordered transformation from pixels to class logits.

    Figure 2: ViT inference flow from image validation and patch embedding to encoder processing and class prediction.

    Mathematical Formulation:
    z_0=[x_{\mathrm{cls}};x_p^1E;x_p^2E;\ldots;x_p^NE]+E_{\mathrm{pos}}
    \mathrm{Attention}(Q,K,V)=\mathrm{softmax}\!\left(\frac{QK^T}{\sqrt{d_h}}\right)V

    Where:

    • z_0 is the initial token sequence supplied to the Transformer encoder.
    • x_{\mathrm{cls}} is the learned class token, and x_p^i is flattened image patch i.
    • E\in\mathbb{R}^{P^2C\times D} projects each P\times P\times C patch to width D, while E_{\mathrm{pos}} supplies positional embeddings.
    • N=(H/P)(W/P) is the patch count for an image of height H, width W, and channel count C.
    • Q, K, and V are query, key, and value matrices; d_h is the per-head query/key width.

    Login to view more content
  • DL0054 Deformable Attention

    What is Deformable Attention and how does it reduce computational complexity for object detection tasks?

    Answer

    Deformable Attention is a sparse attention mechanism that learns dynamic sampling locations instead of attending to all spatial positions uniformly. It uses learned 2D offsets from reference points to sample only the most relevant features, reducing complexity from O(N^2) to O(NK) where K is a small constant (typically 4). This makes it ideal for high-resolution feature maps in object detection where full attention is computationally prohibitive — for a 1024×1024 feature map, standard attention requires ~1M operations per head while deformable attention needs only ~4K.
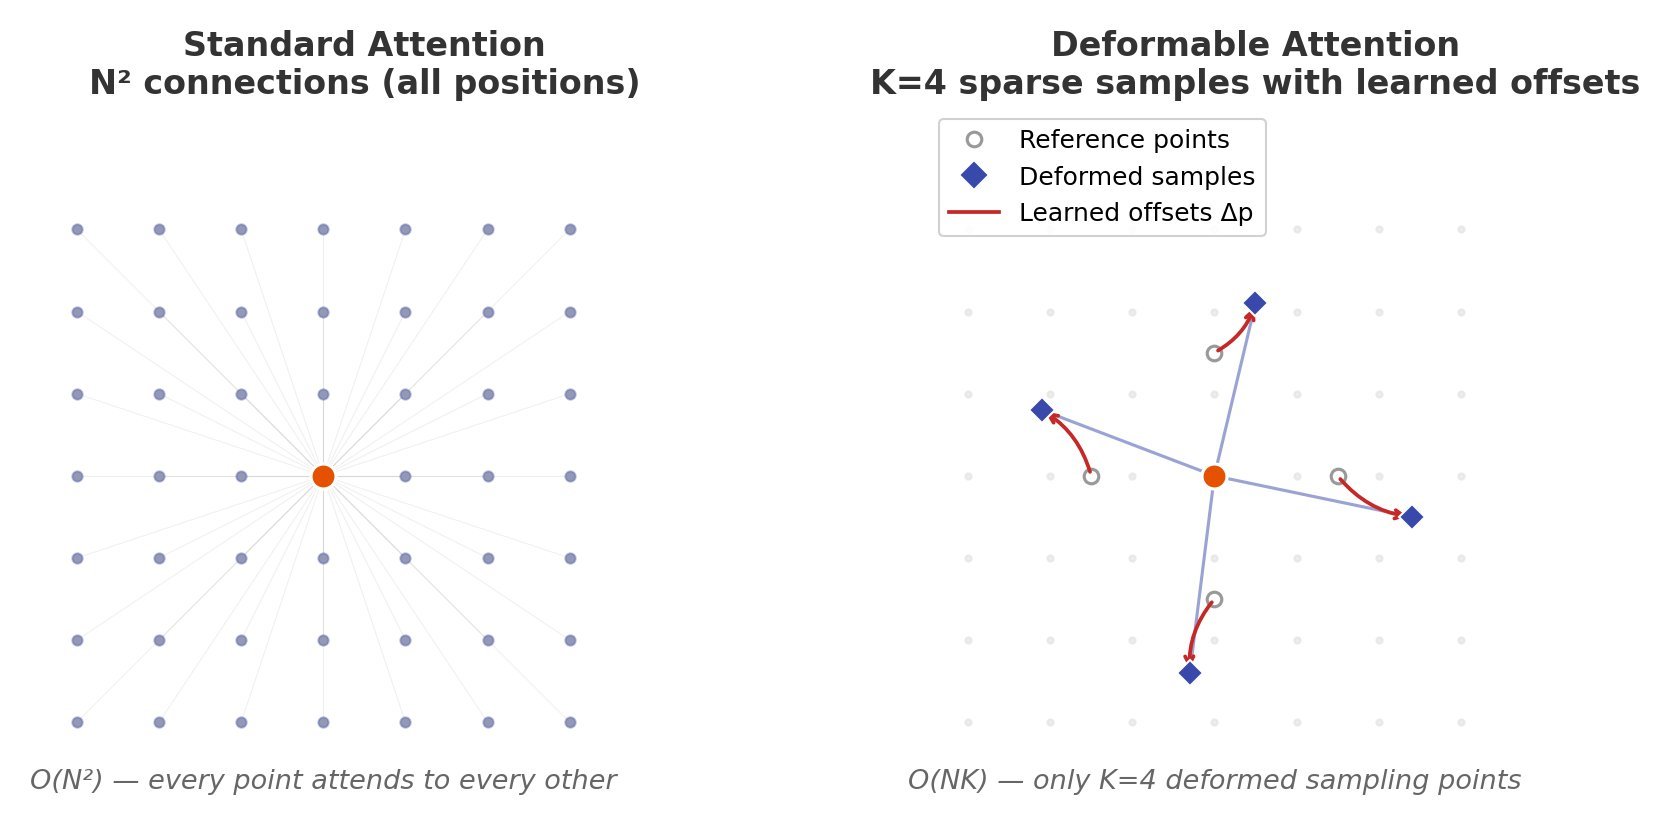
    Sparse Sampling Locations Diagram

    Figure 1: Deformable attention learns K=4 sampling offsets per query point instead of dense N×N attention

    (1) Sparse Sampling: Instead of computing attention over all N \times N positions, deformable attention samples only K reference points per query, typically K=4 or 8, reducing the key-value set from N to K.
    (2) Learned Offsets: The model predicts \Delta p_{mk} offsets from each reference point p_k using a lightweight linear layer on query features, requiring only O(NC) additional computation where C is channel dimension.
    (3) Bilinear Interpolation: When offsets point to non-integer locations, bilinear interpolation computes feature values from the 4 nearest pixels, enabling sub-pixel precision sampling without modifying the feature map.

    Complexity Comparison Chart

    Figure 2: Complexity comparison shows O(NK) grows linearly while O(N²) becomes prohibitive for large feature maps

    Mathematical Formulation:
    y(p) = \sum_{m=1}^{M} W_m \left[ \sum_{k=1}^{K} A_{mk} \cdot W_m' x(p + p_k + \Delta p_{mk}) \right]

    Where:

    •  p is the reference position (query location on the feature map)
    •  M is the number of attention heads
    •  K is the number of sampled keys per head (typically 4)
    •  p_k are fixed reference offsets (uniformly initialized)
    •  \Delta p_{mk} are learned deformable offsets (2D, predicted per head per key)
    •  A_{mk} is the attention weight (normalized, not from softmax over all positions)
    •  W_m, W_m' are projection matrices for each head

    The offsets \Delta p_{mk} are predicted by a linear projection from query features: \Delta p_{mk} = W_\text{offset} \cdot q_m(p), where W_\text{offset} \in \mathbb{R}^{C \times 2K}. The attention weights A_{mk} are computed via a separate softmax over only K elements, not the full N positions. In Deformable DETR, multi-scale deformable attention extends this to sample across multiple feature map resolutions simultaneously, enabling the model to capture both small and large objects efficiently.


    Login to view more content
  • DL0053 Gated Attention

    What is Gated Attention and how does it improve transformer architectures over standard scaled dot-product attention?

    Answer

    Gated Attention (arXiv:2505.06708) applies a head-specific sigmoid gate after Scaled Dot-Product Attention (SDPA) to dynamically modulate attention output. Unlike standard attention where all heads contribute equally, gated attention introduces query-dependent sparse gating that suppresses irrelevant heads and activates only salient ones. This mitigates the attention sink problem where standard transformers concentrate disproportionate attention on the first few tokens, and enhances long-context extrapolation by maintaining diverse attention patterns across sequence lengths.

    Gated Attention Mechanism Diagram

    Figure 1: Gated attention applies a head-specific sigmoid gate after SDPA to modulate attention output before the residual connection

    (1) Post-SDPA Gating: The gate is applied after SDPA computation, not before — each attention head h_i is multiplied by a sigmoid gate g_i = \sigma(W_g \cdot q_i) where W_g is a head-specific projection.
    (2) Sparsity Induction: The sigmoid gate produces values in [0, 1], and empirical measurements show mean gate activation of ~0.116, meaning most heads are heavily suppressed — introducing beneficial sparsity without hard pruning.
    (3) Attention Sink Mitigation: Standard attention allocates ~46.7% of attention mass to the first token; gated attention reduces this to ~4.8%, distributing attention more uniformly across tokens.

    Gate Activation Distribution

    Figure 2: Gate activation distribution across 8 attention heads shows heavy suppression (mean ~0.116) with sparse high-activation regions

    Mathematical Formulation:
    \text{GatedAttn}(Q, K, V) = \text{Concat}(g_1 \odot h_1, \ldots, g_H \odot h_H) W_O
    g_i = \sigma(W_g^{(i)} \cdot q_i + b_g^{(i)})

    Where:

    •  h_i = \text{SDPA}(q_i, k_i, v_i) is the output of the i-th attention head
    •  g_i \in [0, 1] is the head-specific gate score
    •  W_g^{(i)} \in \mathbb{R}^{d_k \times 1} is a learned projection from query to scalar gate
    •  \sigma is the sigmoid function
    •  \odot denotes element-wise multiplication
    •  W_O is the standard output projection

    The gate projection W_g^{(i)} adds only O(d_k) parameters per head — a negligible overhead of ~0.1% of total model parameters — yet significantly improves long-context performance. On the RULER benchmark at 128K context length, gated attention improves needle-in-haystack retrieval accuracy from ~72% to ~94% compared to standard attention.


    Login to view more content
  • MSD0007 Demand Forecasting System for Retailer

    Design a demand forecasting system for a large retail company like Costco, Walmart, or Target. The system should predict future product demand across stores and time to support inventory planning, replenishment, and promotions.

    Answer

    The demand forecasting system ingests diverse data from sales, inventory, weather, and promotions to predict product demand using ML models like time series, tree-based, or deep learning methods.
    This demand forecasting system features a scalable architecture with data pipelines, real-time processing, and integration for inventory management.
    Key benefits include reducing stockouts, optimizing supply chains, and improving accuracy through iterative model training.

    Problem Definition & Success Metrics:
    Define the forecast granularity (e.g., SKU-store-day), horizon (e.g., 2-week operational, 3-month tactical), and objective (e.g., minimize out-of-stocks and waste).
    Key success metrics would be Weighted Mean Absolute Percentage Error (WMAPE) for overall accuracy and forecast bias to detect systematic over/under-prediction.

    Data Strategy & Feature Engineering:
    Integrate diverse data sources into a unified feature store:
    (1) Internal: Historical sales, product hierarchies, pricing, promotional calendars, inventory levels, and online search/click data.
    (2) External: Calendar events (holidays, paydays), weather, local events, competitor activity (scraped), and macroeconomic trends.

    System Architecture:
    (1) Data Ingestion Layer: Batch and real-time streams.
    (2) Processing & Feature Store: Clean, validate, and compute features.
    (3) Modeling Layer: A repository for multiple models, allowing experimentation.
    (4) Serving Layer: Exposes forecasts via APIs to downstream systems (replenishment, pricing).
    (5) Monitoring & Feedback: Tracks model performance, data drift, and incorporates actual sales as ground truth for retraining.


    Modeling Approach with Hierarchical Ensemble Strategy:

    Use a “Top-Down, Bottom-Up” approach. Forecast at the aggregate level (Category/Region) to capture macro-trends and reconcile these with granular SKU(Stock Keeping Unit)-level predictions to ensure total inventory alignment.
    (1) Base Layer (Interpretability): Implement Prophet or Exponential Smoothing for high-level aggregates. This captures clear seasonalities (holidays, paydays) in a way that is easily explainable to business stakeholders.
    (2) Granular Layer (The “Workhorse”): Use Global LightGBM or XGBoost models trained across entire product categories. This allows the model to learn shared patterns across similar items while efficiently handling categorical metadata like Store ID and Brand.
    (3) High-Volatility Layer (Deep Learning): Deploy Temporal Fusion Transformers (TFT) or DeepAR specifically for high-volume or volatile items. These models capture complex, non-linear dependencies and multi-horizon temporal patterns that tree-based models might miss.
    (4) Probabilistic Forecasting: Instead of a single point estimate, generate Quantile Forecasts (e.g., P10, P50, P90). This provides a range of uncertainty, allowing the logistics team to make data-driven decisions on safety stock levels.


    Login to view more content
  • MSD0006 Video Recommendation System

    How would you design a scalable and personalized video recommendation system for a platform like YouTube, Netflix, or TikTok that can recommend relevant videos in real time to billions of users?

    Answer

    A modern recommendation system uses a multi-stage pipeline to narrow down billions of videos to a top-20 list for a user in milliseconds.
    It typically consists of:
    (1) Candidate Generation (filtering down to hundreds),
    (2) Ranking (scoring those hundreds using deep learning), and
    (3) Re-ranking (applying business logic to ensure diversity, freshness, and safety or applying ad insertion).

    The pipeline is: Data Logging -> Candidate Generation -> Ranking -> Re-ranking -> Serving.

    Preparation for Data & Features
    (1) User: watch history, watch time, likes, skips, follows
    (2) Video: visual/audio/text embeddings, popularity, freshness
    (3) Context: time of day, device, network

    Candidate Generation (Retrieval):
    This stage quickly reduces billions of videos to a manageable set (~100-500) from several sources; these sources are merged, deduplicated, and passed to the ranking stage:
    (1) Collaborative Filtering (CF): Use matrix factorization or two-tower neural networks to create user and video embeddings. Retrieve videos similar to those the user has engaged with. This is the primary source.
    (2) Content-Based: Use video title, description, audio, and frame embeddings to find videos similar to those the user likes.
    (3) Seed-Based (Graph): For a “Watch Next” scenario, use the current video as a seed and find co-watched videos (e.g., “users who watched X also watched Y”).
    (4) Trending/Global: Inject popular videos in the user’s region/language to promote freshness and viral content.

    Ranking (Scoring):
    The goal is to precisely order the ~500 candidates from retrieval. This model can be more complex and slower.
    (1) Deep Neural Networks (DNNs): The industry standard. Takes in hundreds of concatenated features (user, video, cross-features) through multiple fully-connected layers to output a single score (e.g., predicted watch time). Captures complex, non-linear interactions.
    (2) Multi-Task Learning (MTL): A key advancement. Instead of predicting just one objective (e.g., click), a single model with shared hidden layers has multiple output heads (e.g., for click, watch time, like, share). This improves generalization by sharing signals between tasks and helps balance engagement with satisfaction.
    (3) Sequence/Transformer Models: To model the user’s immediate session context, models can treat the sequence of recently watched videos as input (using RNNs or Transformers). This helps predict the “next best video” in the context of the current viewing mood.

    Re-ranking & Post-Processing:
    Final polish of the list. Apply business and quality constraints such as diversity, freshness, safety filters, and exploration strategies before producing the final feed.
    (1) Filters: Remove videos the user has already seen, filter out “shadow-banned” or inappropriate content.
    (2)Diversity: Ensure the top 10 isn’t just one creator; inject different categories to avoid “filter bubbles.”


    Login to view more content
  • MSD0005 Surveillance Video Anomaly Detection

    How would you design an end-to-end surveillance system that automatically detects and alerts security personnel to ‘anomalous events’ (e.g., break-ins, fainting, or prohibited movements) in a large shopping mall?

    Answer

    A surveillance anomaly detection system captures video streams, preprocesses them into clips, and uses a deep learning model, typically a pretrained video backbone plus a lightweight anomaly scoring head, to identify unusual behavior.
    It operates in a semi-supervised setup trained on normal data, runs in real time with sliding windows and temporal smoothing.
    The system also includes alerting, monitoring, and a human-in-the-loop feedback loop for calibration and retraining.

    Data Ingestion & Preprocessing: Capture real-time video streams from multiple cameras. Preprocess by resizing frames and normalizing pixel values.

    Model architecture:
    (1) Feature Extraction: A 2D CNN (like EfficientNet) extracts spatial features. To capture motion, we use Optical Flow or a 3D CNN (I3D) or a Video Transformer (Video Swin Transformer or TimeSformer) to look at blocks of frames together.
    (2) The “Normal” Model: We train an Autoencoder or a Generative Adversarial Network (GAN) on months of “normal” mall activity.
    (3) Detection Logic: When the model sees something new, its “reconstruction error” will be high. If the error exceeds a set threshold, it is flagged as an anomaly. Use the validation dataset for threshold calibration.

    Alerting & Visualization: Generate real-time alerts. Send anomalous frames for human operators to review. Implement a Human-in-the-Loop system where guards can click “Not an Anomaly.”

    System Considerations:

    (1) Scalability: Use edge devices for preliminary processing to reduce bandwidth; cloud processing for heavy computation.
    (2) Latency: Optimize frame rate and model inference time to enable near real-time detection.
    (3) Evaluation: Test using precision, recall, F1-score, and monitor false positives/negatives.


    Login to view more content
  • DL0052 Rotary Positional Embedding

    What is Rotary Positional Embedding (RoPE)?

    Answer

    Rotary Positional Embedding (RoPE) is a positional encoding method that rotates query and key vectors in multi‑head attention by position‑dependent angles. This rotation naturally encodes relative positional information, improves generalization to longer contexts, and avoids the limitations of fixed or learned absolute positional embeddings. It is used in GPT-NeoX, LLaMA, PaLM, Qwen, etc.
    It has below charactretidstics:
    (1) Relative position encoding method for Transformers
    (2) Applies rotation to query (Q) and key (K) vectors using position-dependent angles
    (3) Encodes position via geometry, not by adding vectors
    (4) Preserves relative distance naturally in dot-product attention
    (5) Extrapolates well to longer sequences than the training length

    RoPE rotates each 2D pair of hidden dimensions:
    f(x, m)=\begin{pmatrix}\cos(m\theta) & -\sin(m\theta) \\ \sin(m\theta) & \cos(m\theta)\end{pmatrix}\begin{pmatrix}x_1 \\x_2\end{pmatrix}
    Where:
     m represents the absolute position of the token in the sequence.
     \theta represents the base frequency/rotation angle.
     x_1, x_2 represent the components of the embedding vector.

    The below plot visualizes how RoPE makes attention decay smoothly with relative distance, while standard sinusoidal PE reflects absolute position similarity.


    Login to view more content
  • DL0051 Sparsity in NN

    Explain the concept of “Sparsity” in neural networks.

    Answer

    Sparsity in neural networks refers to the property that many parameters (weights) or activations are exactly zero (or very close to zero).
    This leads to lighter, faster, and more interpretable models. Techniques such as L1 regularization, pruning, and ReLU activations help enforce sparsity, making networks more efficient without compromising performance.

    Common techniques and their equations:
    (1) L1 Regularization (encourages sparse weights)
     L = L_{\text{task}} + \lambda \sum_i |w_i|
    Where:
     w_i represents the i-th model weight
     \lambda controls the strength of sparsity

    (2) ReLU Activation (induces sparse activations)
     \mathrm{ReLU}(x) = \max(0, x)
    Where:
     x is the neuron input.

    The plot below shows weight distributions trained without using L1 and with L1-induced sparsity.


    Login to view more content