Author: admin

  • MSD0004 Long Document Attention Scalability

    The standard Transformer’s self-attention mechanism has a computational and memory complexity of  O(N^2) , where  N is the sequence length. For long document classification (e.g., thousands of tokens), this quadratic scaling becomes prohibitive.

    Describe one or more attention modifications you would design or choose to enable efficient and effective long document classification.

    Answer

    To handle long documents, the quadratic complexity of full self-attention (  O(N^2) ) must be reduced. The primary approaches involve Sparse Attention (like Longformer or BigBird) and Hierarchical Attention (like HATN).
    Sparse attention constrains each token to only attend to a limited, relevant subset of tokens (local window and global tokens), while hierarchical attention segments the document and applies attention at both the sentence/segment level and the document level.
    (1) Sparse Attention (Mechanism):
    Replaces the full attention matrix with a sparse design.
    Local Window Attention: Each token attends to its immediate neighbors, which is crucial for local context.
    Global Attention: A few special tokens (e.g., [CLS]) act as global connectors that exchange information with all tokens, preserving long-range dependencies. (Models: Longformer, BigBird).

    Here is a side-by-side comparison of Global Attention and Sliding Window Attention:

    (2) Hierarchical Attention (Structure):
    Hierarchical Attention (Structure)
    Splits the long document into smaller, manageable segments (sentences or paragraphs).
    Segment-level: Applies a standard Transformer token-level attention within each segment.
    Document-level: Applies a separate document attention over the segment-level representations (e.g., the [CLS] token of each segment) to capture global dependencies. (Models: HATN, LNLF-BERT).

    The figure below shows Hierarchical Attention used in the document classification use case.


    Login to view more content
  • MSD0003 Spam Email Detection

    Design an end-to-end Machine Learning system to effectively detect and filter spam emails in a high-volume email service.

    Describe how you would design, train, and deploy this system.

    Answer

    The ML system for spam detection is a real-time classification pipeline. It begins with data collection and preprocessing (features extracted from text and metadata). A Supervised Learning model (e.g., Logistic Regression, Gradient Boosting, or a Neural Network) is trained on labeled data. The model is deployed as a real-time prediction service that intercepts incoming emails. Performance is monitored using metrics like precision and recall, and the model is continuously retrained to adapt to new spamming techniques (concept drift).

    (1) Objectives and Metrics:
    The goal is to classify incoming emails as spam or not spam in real time, minimizing false positives (mislabeling important emails as spam) while maintaining high recall (catching most spam).
    (a) Primary Metric: Precision is critical. A high False Positive rate (marking legitimate emails as spam) is highly detrimental to user experience.
    (b) Secondary Metric: Recall is also important to ensure most spam is caught (low False Negative rate).
    (c) Evaluation Metric: The F1-score or Area Under the ROC Curve (AUC) provides a good balance.

    (2) Data Collection:
    (a) Sources: Historical emails labeled by users (spam / not spam). External spam datasets (e.g., Enron spam dataset).
    (b) Features to collect:
    Email text: subject and body.
    Metadata: sender address, domain reputation, number of recipients.
    Other: Embedded links, presence of attachments, message frequency.

    (3) Data Preprocessing and Feature Engineering:
    (a) Text cleaning: Remove HTML tags, URLs, punctuation.
    (b) Tokenization: Split text into words/subwords (WordPiece).
    (c) Textual Features Vectorization:
    Classical: Term Frequency-Inverse Document Frequency (TF-IDF) or bag-of-words.
    Modern: Pretrained embeddings (BERT, DistilBERT).
    (d) Metadata Features Engineering:
    Sender reputation score.
    Ratio of uppercase words or spam keywords.
    Number of links or suspicious domains.

    (4) Model Selection and Training:
    (a) Baseline Models: Start with Naive Bayes or Logistic Regression.
    (b) Advanced Models: Ensemble methods like Random Forest or XGBoost, deep learning with CNNs/RNNs on text sequences, or pre-trained transformers like BERT for state-of-the-art performance.
    (c) Training Process: Split the dataset for train/test; Use K-Fold Cross-Validation on a historical dataset, and maintain a separate held-out test set for final evaluation. For large-scale, distributed training with TensorFlow or PyTorch on GPUs.

    (5) Deployment & Inference:
    (a) Deployment Architecture: The trained model is saved (e.g., in a model registry) and loaded into a low-latency prediction service.
    (b) Inference Flow:
    The inference flow is shown in the figure below.

    Step 1: The mail server receives incoming email.
    Step 2: The email content and headers are passed to the Spam Prediction Service API.
    Step 3: The service performs real-time feature extraction and feeds the feature vector to the loaded model.
    Step 4: The model returns a spam probability score (e.g., 0.95).
    Step 5: A threshold is applied (e.g., a score greater than 0.8 is classified as spam).
    Final Action: If classified as spam, the email is moved to the user’s spam folder; otherwise, it goes to the inbox.

    (6) Maintenance and Monitoring
    One critical part of a spam system is its ability to adapt to Concept Drift—spammers constantly change their tactics.
    (a) Performance Monitoring: Track and alert on key metrics.
    User Feedback: Explicit ‘Mark as Spam’ or ‘Not Spam’ actions are the best source of new labeled data.
    Model Accuracy: Monitor Precision, Recall, and F1-score daily.
    Prediction Drift: Monitor the distribution of prediction scores. A sudden drop in the average predicted spam score might indicate the model is no longer effective.
    (b) Retraining Pipeline: Implement a Continuous Training pipeline.


    Login to view more content

  • MSD0002 Image to Video Classification

    You are given a pretrained image classification network, such as ResNet. How would you adapt it to perform video classification, ensuring that both spatial and temporal information are captured?

    Please discuss possible architectural modifications and trade-offs between different approaches.

    Answer

    Adding temporal modeling is essential when adapting an image-classification CNN for video classification. Options include:
    (1) 3D CNNs (C3D/I3D):
    Extend 2D convs to 3D to learn motion. Inflating 2D convolutions into 3D. (Example: I3D inflates 2D ResNet filters into 3D filters using pretrained ImageNet weights.)
    Pros: Superior capability to capture fine-grained motion and spatio-temporal features.
    Cons: High computational cost and high demand for video training data (Can be mitigated by I3D-style inflation).

    (2) Combining frame-level CNN features with RNN/LSTM/TCN/Transformer:
    Use CNN for spatial feature extraction, sequence model for temporal modeling with the extracted spatial features.
    Pre-train CNN on the target dataset to conduct image classification might improve the performance.
    Pros: Leverages powerful 2D CNN pre-training easily, lower computational cost. Flexible, handles variable-length sequences and can be good at modeling long-term sequence dependencies.
    Cons: Less effective at modeling local and subtle motion features without further specialize temporal modeling design.

    The below figure demonstrate the CNN combined with RNN/LSTM/TCN/Transformer modelling process.

    (3) Temporal pooling/attention:
    Simple frame aggregation with average/max pooling or attention.
    Pros: Lightweight, efficient. Useful when frame order is less critical or resources are limited.
    Cons: May lose fine-grained motion cues.


    Login to view more content
  • MSD0001 Real-Time Factory Product Inspection

    You are tasked with designing and deploying a deep learning-based computer vision system for real-time quality control on a high-speed manufacturing assembly line. The system must classify each product as ‘Pass’ or ‘Fail’ due to surface defects (scratches, cracks, misalignments).

    Describe the complete end-to-end system design, from data acquisition and model selection to deployment and post-deployment maintenance.

    Crucially, how would you address the challenges of real-time inference speed and the severe class imbalance due to the fact that defects are rare?”

    Answer

    The solution is an Edge-AI Computer Vision Pipeline. It starts with a controlled imaging setup to capture high-quality, consistent images. The core is a lightweight CNN (e.g., MobileNet) leveraging Transfer Learning, with a specialized loss function (e.g., Focal Loss) to handle class imbalance. Deployment occurs on a local Edge GPU to guarantee low-latency inference. A continuous MLOps loop monitors performance and facilitates model retraining against new or subtle defects (concept drift).

    (1) Data & Setup: Controlled environment (lighting/staging), high-resolution cameras, and conduct Transfer Learning to reduce the need for large-scale data collection.
    (2) Imbalance Handling: Use Focal Loss or weighted loss functions, combined with heavy data augmentation and oversampling of the ‘Fail’ class.
    (3) Model Architecture: Choose a lightweight CNN (e.g., MobileNetV2, EfficientNet-B0) optimized for speed over a very large, deep network.
    (4) Real-Time Deployment: Edge deployment on an industrial GPU (e.g., NVIDIA Jetson) using model optimization/quantization (e.g., ONNX, TensorRT) to ensure sub-100ms inference.
    (5) Post-Deployment MLOps: Implement a feedback loop for logging all classifications (especially False Negatives) and trigger periodic retraining to combat model drift.


    Login to view more content
  • DL0050 Knowledge Distillation

    Describe the process and benefits of knowledge distillation.

    Answer

    Knowledge Distillation (KD) transfers “dark knowledge” about inter-class relationships from a large, accurate teacher model to a smaller student model. The student learns via a temperature-scaled softmax and a combined distillation plus supervised loss, enabling substantial model compression and faster inference while retaining high accuracy, provided that the teacher quality, student capacity, and hyperparameters are well chosen.

    Definition: Knowledge distillation is a process where a smaller model (student) learns to mimic the behavior of a larger, well-trained model (teacher).

    Soft Targets: The student is trained not only on hard labels (one-hot) but also on the soft output probabilities of the teacher.

    Temperature Scaling: Teacher logits are softened using a temperature T to reveal more information about class similarities:
    \mbox{Softmax}(z_i / T) = \frac{e^{z_i / T}}{\sum_{j=1}^{K} e^{z_j / T}}
    Where:
     z_i : Raw score (logit) for the i-th class.
     K : Total number of classes in the classification problem.
     T : Temperature parameter (>0) used to soften the probabilities. Higher  T produces a smoother distribution, revealing relationships between classes (“dark knowledge”).

    The below plot shows the Softmax probabilities for a fixed set of Teacher logits under three different temperatures. Increasing the temperature smooths the distribution.

    Loss Function: Typically combines distillation loss (difference between teacher and student soft outputs) and standard cross-entropy loss with true labels.

    Key Benefits of KD:
    (1) Model compression: the student is smaller and faster while retaining much of the teacher’s performance, enabling deployment on resource-constrained devices.
    (2) Inference Speed: Significantly decreases latency, making the model suitable for deployment on edge devices or real-time applications.
    (3) Improved Generalization: The Teacher’s smooth soft targets act as a form of powerful regularization, often leading the Student to generalize better than if it were trained only on hard labels.

    The plot below demonstrates the Knowledge Distillation (KD) process.


    Login to view more content

  • DL0049 Weight Init

    Why is “weight initialization” important in deep neural networks?

    Answer

    Weight initialization is crucial for stabilizing activations and gradients, enabling deep neural networks to train efficiently and converge faster without numerical instability.
    (1) Prevents vanishing/exploding gradients: Proper initialization keeps activations and gradients within reasonable ranges during forward and backward passes
    (2) Ensures faster convergence: Good initialization allows the optimizer to reach a good solution more quickly.
    (3) Breaks symmetry: Different initial weights ensure neurons learn unique features rather than identical outputs.

    Xavier Initialization
    is used for activations like Sigmoid or Tanh:
    Xavier aims to keep the variance of activations consistent across layers for symmetric activations (tanh/sigmoid).
     W \sim \mathcal{N}\left(0, \frac{1}{n_{\text{in}} + n_{\text{out}}}\right)
    or (uniform version):
     W \sim \mathcal{U}\left(-\sqrt{\frac{6}{n_{\text{in}} + n_{\text{out}}}},  \sqrt{\frac{6}{n_{\text{in}} + n_{\text{out}}}}\right)
    Where:
     n_{\text{in}} = number of input units
     n_{\text{out}} = number of output units
     \mathcal{N}(\mu, \sigma^2) means weights are sampled from a normal (Gaussian) distribution with mean  \mu and variance  \sigma^2 .
     \mathcal{U}(a, b) means weights are sampled from a uniform distribution in the range  [a, b] .

    He Initialization is used for activations like ReLU or Leaky ReLU:
    He initialization scales up the variance for ReLU, since half of its outputs are zero, preventing vanishing activations.
     W \sim \mathcal{N}\left(0, \frac{2}{n_{\text{in}}}\right)
    or (uniform version):
     W \sim \mathcal{U}\left(-\sqrt{\frac{6}{n_{\text{in}}}},  \sqrt{\frac{6}{n_{\text{in}}}}\right)
    Where:
     n_{\text{in}} = number of input units

    He initialization is recommended for ReLU networks as shown in the plot below.


    Login to view more content
  • DL0048 Adam Optimizer

    Can you explain how the Adam optimizer works?

    Answer

    The Adam (Adaptive Moment Estimation) optimizer is a powerful algorithm for training deep learning models, combining the principles of Momentum and RMSprop to compute adaptive learning rates for each parameter.
    Adam updates following the steps below:
    (1) First Moment Calculation(Mean/Momentum)
    It computes an exponentially decaying average of past gradients, which is the estimate of the first moment (mean) of the gradient. This introduces a momentum effect to smooth out the updates.
    m_t = \beta_1 m_{t-1} + (1 - \beta_1) g_t
    Where:
    m_t is the 1st moment (mean of gradients).
    g_t is the gradient at step t.
    \beta_1 controls momentum (default: 0.9).

    (2) Second Moment Calculation (Variance)
    Adam also computes an exponentially decaying average of past squared gradients, which is the estimate of the second moment (uncentered variance) of the gradient. This provides a measure of the scale (magnitude) of the gradients.
    v_t = \beta_2 v_{t-1} + (1 - \beta_2) g_t^2
    Where:
    v_t is the 2nd moment (variance of gradients).
    \beta_2 controls smoothing of squared gradients (default: 0.999).

    (3) Bias Correction
    Since m_t​ and v_t ​ are initialized as zero vectors, they are biased towards zero, especially during the initial steps. Adam applies bias correction to these estimates.
    \hat{m}_t = \frac{m_t}{1 - \beta_1^t}
    \hat{v}_t = \frac{v_t}{1 - \beta_2^t}
    Where
    \hat{m}_t is the bias-corrected 1st moment.
    \hat{v}_t is the bias-corrected 2nd moment.
    \beta_1^t, \beta_2^t are the exponential decay raised to step t, correcting bias from initialization.

    (4) Parameter Update
    The final parameter update scales the bias-corrected first moment (m_t) by the overall learning rate (\alpha) and divides by the square root of the bias-corrected second moment (v_t​).
    \theta_t = \theta_{t-1} - \alpha \frac{\hat{m}_t}{\sqrt{\hat{v}_t} + \epsilon}
    Where:
    \theta_t are model parameters.
    \alpha is the learning rate.
    \epsilon prevents division by zero.

    The plot below shows how the Adam optimizer efficiently moves from the starting point to the minimum of the quadratic bowl, taking adaptive steps that quickly converge to the origin.


    Login to view more content

  • DL0047 Focal Loss II

    Please compare focal loss and weighted cross-entropy.

    Answer

    Weighted Cross-Entropy (WCE) rescales loss by class to correct prior imbalance and is simple and robust for noisy labels; Focal Loss (FL) multiplies cross-entropy by a difficulty-dependent factor \gamma to suppress easy-example gradients and focus learning on hard examples, making it preferable when many easy negatives overwhelm training but requiring careful tuning to avoid amplifying label noise.

    \text{WeightedCE}(p_t) = -\alpha_t \log(p_t)
    Where:
    p_t is the model probability for the ground-truth class;
    \alpha_t is the per-class weight for class t.

    \text{FocalLoss}(p_t) = -\alpha_t (1 - p_t)^\gamma \log(p_t)
    Where:
    p_t is the model probability for the ground-truth class;
    \alpha_t is the optional per-class weight for class t;
    \gamma \ge 0 is the focusing parameter that down-weights easy examples.

    Here is a table to compare focal loss and weighted cross-entropy.

    The figure below compares Cross-Entropy, Weighted Cross-Entropy, and Focal Loss.


    Login to view more content

  • DL0046 Focal Loss

    What is focal loss, and why does it help with class imbalance?

    Answer

    Focal loss augments cross-entropy with a modulating term (1 - p_t)^\gamma and an optional balancing weight \alpha_t to suppress gradients from easy, majority-class examples and amplify learning from hard or minority-class examples, improving performance in severe class-imbalance settings when hyperparameters are properly tuned.
    (1) Focal loss formula:
    \text{FocalLoss}(p_t) = -\alpha_t (1 - p_t)^\gamma \log(p_t)
    Where:
    p_t is the model probability for the ground-truth class;
    \gamma \ge 0 is the focusing parameter that down-weights easy examples;
    \alpha_t \in (0,1) is an optional class-balancing weight for class t.

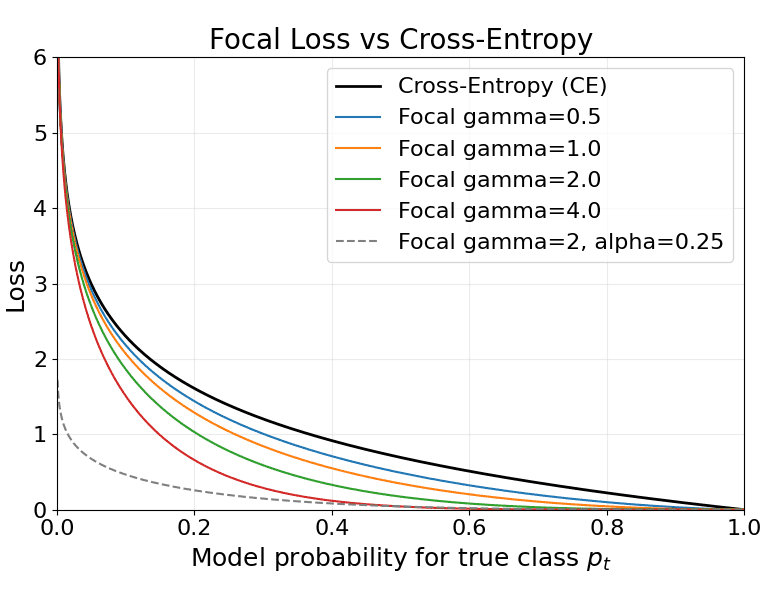
    (2) Modulation: The factor (1 - p_t)^\gamma reduces loss from well-classified (high-confidence) examples, concentrating gradients on hard / low-confidence examples.

    (3) Class imbalance effect:
    In cross-entropy, abundant, easy negatives still produce a large total gradient, dominating learning.
    Focal loss down-weights those contributions, ensuring rare/difficult samples have a stronger influence.

    The plot below shows cross-entropy and focal-loss curves for several \gamma values and an example \alpha.


    Login to view more content

  • DL0045 Dimension in FFN

    In Transformers, why does the feed-forward network expand the hidden dimension (e.g.,  d_{\text{model}} 4 d_{\text{model}} ) before reducing it back?

    Answer

    The feed-forward network in Transformers expands the hidden dimension (e.g.,  d_{\text{model}} \to 4 \cdot d_{\text{model}} ) to enhance the model’s ability to learn complex, non-linear feature interactions, then reduces it back to maintain compatibility with other layers. This design acts as a bottleneck, balancing expressiveness and efficiency, and has been empirically shown to boost performance in large-scale models.
    (1) Extra Capacity: Expanding from  d_{\text{model}} to  4d_{\text{model}} allows the FFN to capture richer nonlinear transformations.
    (2) Non‑linear mixing: The intermediate expansion allows the activation function (ReLU, GeLU, SwiGLU, etc.) to operate in a richer space, capturing more complex patterns.
    (3) Projection back ensures compatibility: Reducing the dimension back to  d_{\text{model}} ensures compatibility with the subsequent layers. It ensures residual connection compatibility and uniformity across layers.

    The equation and the figure below show the architecture of FFN:
     \text{FFN}(x) = W_2  \sigma(W_1 x + b_1) + b_2
    Where:
     x \in \mathbb{R}^{d_{\text{model}}} is the input vector.
     W_1 \in \mathbb{R}^{4d_{\text{model}} \times d_{\text{model}}} expands the dimension.
     \sigma is a non-linear activation (e.g., ReLU/GELU).
     W_2 \in \mathbb{R}^{d_{\text{model}} \times 4d_{\text{model}}} projects back down.


    Login to view more content