Author: admin

  • DL0032 Transformer VS RNN

    What makes Transformers more parallel-friendly than RNNs?

    Answer

    The fundamental difference is dependency structure: an RNN computes each hidden state from the previous one, h_t = f(h_{t-1}, x_t), so step t cannot start before step t-1 finishes. A Transformer replaces recurrence with self-attention, which scores every pair of positions simultaneously, so all tokens are processed in one parallel pass. This turns sequential loops into dense matrix multiplications that saturate modern GPUs.

    (1) No Temporal Dependency: Transformers process all input tokens at once; there is no hidden-state chain forcing order.
    (2) Fully Parallelizable Attention: All n^2 attention scores are computed in a single matrix product QK^\top, and the FFN applies to all positions simultaneously.
    (3) Optimized for GPUs: Large GEMM kernels keep thousands of GPU cores busy, unlike the RNN’s long chain of small dependent steps.

    Mathematical Formulation:
    h_t = f(h_{t-1},\, x_t)
    S = QK^\top

    Where:

    • h_t is the RNN hidden state at step t; it cannot be computed before h_{t-1} exists.
    • S is the full n \times n attention score matrix, produced by one parallel GEMM from the query and key matrices Q, K.
    Side-by-side diagram of an unrolled RNN processing inputs one cell at a time through a hidden-state chain versus a Transformer block receiving all tokens at once in parallel.

    Figure 1: RNN: a serial chain where each step waits for the previous hidden state; Transformer: the whole sequence enters the block simultaneously.

    Training-Time Consequence: With a sequence of length n, an RNN needs n sequential steps no matter how much hardware you have: latency grows linearly with sequence length. A Transformer’s forward pass is a constant number of parallel matrix operations; the cost grows in FLOPs, not in wall-clock dependency depth.

    Computation graph comparison showing the RNN as a vertical chain of dependent cell evaluations versus the Transformer as three wide parallel layers of matrix operations.

    Figure 2: Dependency depth: RNN needs n ordered steps; the Transformer needs only O(1) sequential layers, each internally parallel.

    AspectRNNTransformer
    Token dependencySequential: h_t needs h_{t-1}None: all tokens at once
    Training steps for n tokensn ordered stepsOne parallel pass
    Core operationMany small vector updatesLarge batched GEMMs
    Long-range signal pathThrough n hidden states (vanishing gradients)One attention hop, O(1) path length

    Why It Matters: Parallelism is why Transformers can train on web-scale corpora (a workload that would take an RNN impractically long to finish), and why attention became the default sequence model in modern NLP.


    Login to view more content
  • DL0031 FFN in Transformer

    What is the purpose of the feed-forward network inside each Transformer block?

    Answer

    The feed-forward network (FFN) inside each Transformer block processes every token independently after attention: it expands the token’s features into a higher-dimensional space, applies a non-linearity, and projects back to the model dimension. Attention mixes information across tokens; the FFN then deepens each token’s representation individually. It is where most of the block’s parameters and feature transformations actually happen.

    (1) Non-Linear Transformation: Adds the only per-token non-linearity in the block, letting the model capture complex patterns that attention’s linear weighting cannot express.
    (2) Token-Wise Processing: The same MLP is applied to each position separately: no cross-position mixing, so it parallelizes trivially over the sequence.
    (3) Dimensional Expansion: The hidden layer typically expands d_{model} by a factor of 4 (e.g., 512 → 2048), giving the network capacity to re-encode features before compressing them back.

    Mathematical Formulation:
    \mathrm{FFN}(x) = \max(0,\; xW_1 + b_1)\, W_2 + b_2

    Where:

    • x \in \mathbb{R}^{d_{model}} is one token’s vector after the attention sub-layer; the same function is applied to every position.
    • W_1 \in \mathbb{R}^{d_{model} \times d_{ff}}, W_2 \in \mathbb{R}^{d_{ff} \times d_{model}} are trainable weights; typically d_{ff} = 4\, d_{model}.
    • \max(0, \cdot) is the ReLU activation of the original paper; modern models swap in GELU or gated variants like SwiGLU.
    Diagram of the FFN expanding a token vector from 512 dimensions to 2048 through the first linear layer, applying GELU, and compressing back to 512 through the second linear layer.

    Figure 1: d \to 4d \to d: expand, activate, compress. The same two-layer MLP for every token position.

    Why the Expansion Matters: Projecting up to d_{ff} gives the network a wide workspace to recombine and re-weight the features attention produced; the second matrix then distills the result back to d_{model}. Roughly two-thirds of a vanilla Transformer’s parameters live in these FFN matrices.

    Complement to Attention: Multi-head attention is a weighted average of value vectors, a linear operation per head. Without the FFN, stacking attention layers would compose mostly linear maps; the FFN’s expansion + non-linearity supplies the representational depth that makes deep stacks worthwhile.


    Login to view more content
  • DL0030 Positional Encoding

    Explain “Positional Encoding” in Transformers. Why is it necessary?

    Answer

    Positional encoding injects token order into a Transformer’s input representations. Self-attention is permutation-invariant: shuffling the input tokens shuffles the outputs identically, so without positional information the model literally cannot tell “dog bites man” from “man bites dog”. Positional encodings add position-dependent vectors to the token embeddings before the Q, K, V projections, baking order awareness into every attention score.

    (1) Fixed Sinusoidal: Parameter-free sine/cosine waves of geometrically spaced frequencies; encodes absolute position and extrapolates to unseen sequence lengths.
    (2) Learned Embeddings: A trainable vector per position index, flexible and task-adaptive, but capped at the maximum training length.
    (3) Relative Schemes: Encode distances between token pairs inside attention (RoPE, ALiBi) rather than absolute positions, the modern default in LLMs.

    Heatmap of sinusoidal positional encoding values across 100 token positions and 64 embedding dimensions showing fast oscillations in low dimensions and slow stripes in high dimensions.

    Figure 1: The sinusoidal PE matrix: low dimensions oscillate fast (fine position), high dimensions vary slowly (coarse position), giving every position a unique fingerprint.

    Mathematical Formulation (Sinusoidal):
    PE_{(pos,\, 2i)} = \sin\left(\frac{pos}{10000^{2i / d_{model}}}\right)
    PE_{(pos,\, 2i+1)} = \cos\left(\frac{pos}{10000^{2i / d_{model}}}\right)

    Where:

    • pos is the token’s position in the sequence; i indexes the embedding-dimension pair.
    • d_{model} is the embedding dimension; wavelengths grow geometrically from 2\pi to 2\pi \cdot 10000 across dimensions.

    Why Multiple Frequencies: Each dimension pair is a wave of a different wavelength, so positions map to a unique multi-scale code; nearby positions also differ smoothly, giving the model an easy signal for relative offsets.

    Three sine curves of positional encoding versus token position at different embedding dimensions with wavelengths ranging from about 6 to over 20000 positions.

    Figure 2: Three PE dimensions as functions of position: the geometric frequency ladder lets the network read both fine and coarse order.

    Where It Is Applied: z_i = x_i + PE_i: add the encoding to each token embedding first, then compute Q = ZW^Q, K = ZW^K, V = ZW^V, so position is present in every attention score from the start.


    Login to view more content
  • DL0029 Dilated Attention

    Could you explain the concept of dilated attention in transformer architectures?

    Answer

    Dilated attention sparsifies self-attention by letting each query attend only to every d-th key position (a strided subset of the sequence) instead of all keys or a contiguous window. Borrowed from dilated convolutions in CNNs, the dilation rate d controls the stride: attention keeps a long global reach (the sampled keys span the whole sequence) while computing only about 1/d of the score matrix. The trade-off is granularity: nearby fine detail is skipped within each head.

    (1) Strided Sampling: Query i attends to keys j where (j - i) is a multiple of d; d = 1 recovers full attention.
    (2) Global but Sparse: Unlike sliding windows, coverage spans the entire sequence: long-range links survive, sampled coarsely.
    (3) Cost Reduction: Each row computes roughly n/d scores, so compute and memory drop from O(n^2) toward O(n^2 / d).

    A 16x16 attention matrix where each query attends only to every third key position forming a regular striped dilated pattern with dilation rate three.

    Figure 1: Dilation d = 3: each query attends every 3rd key: full-span coverage with a third of the computations.

    Mathematical Formulation:
    \mathrm{Attention}_{dilated}(Q, K, V) = \mathrm{softmax}\left(\frac{Q K_d^{\top}}{\sqrt{d_k}}\right) V_d
    K_d, V_d = \text{rows of } K, V \text{ at strided (dilated) positions}

    Where:

    • d is the dilation rate, the stride between attended key positions.
    • K_d, V_d are the dilated subsets of keys and values (about n/d rows per query).
    • d_k is the key dimension, used for the usual softmax scaling.

    Coverage Through Stacking: Layers with increasing dilation rates (e.g., 1, 2, 4, 8) progressively widen and interleave coverage, so deeper layers see the full sequence even though each layer is sparse: the same trick as WaveNet’s exponentially dilated convolutions.

    Propagation of a single active position through two iterations of dilation-2 attention showing a regular grid of covered cells with gaps that never get attended.

    Figure 2: Gridding artifacts: repeating one fixed dilation leaves some positions permanently unattended. Mixing dilation rates closes the gaps.


    Login to view more content
  • DL0028 Sliding Window Attention

    Explain the sliding window attention mechanism in transformer architectures.

    Answer

    Sliding window attention restricts each token’s attention to a fixed-size local neighborhood instead of the whole sequence: token i attends only to tokens within roughly \pm w/2 positions of itself. This turns the dense n \times n attention matrix into a sparse band around the diagonal, cutting cost from O(n^2) to O(n \cdot w) and making Transformers practical for very long documents, at the price of losing direct long-range links within a single layer.

    (1) Local Window: Each token sees itself plus its w nearest neighbors; everything else is masked out before the softmax.
    (2) Linear Scaling in n: Cost per token is constant (w keys), so total compute and memory grow linearly with sequence length.
    (3) Trade-off: Excellent for local patterns, but global context must be recovered by stacking layers, adding global tokens, or mixing with dilated windows.

    Two attention matrices: a fully dense global attention matrix versus a sliding window matrix with attention confined to a band of width five around the diagonal.

    Figure 1: Global attention fills the whole n \times n matrix; the sliding window keeps only a diagonal band of width w.

    Mathematical Formulation:
    A_{ij} = \frac{q_i \cdot k_j}{\sqrt{d_k}} \quad \text{only if } |i - j| \leq \tfrac{w}{2}, \text{ else masked}
    \text{Cost: } O(n^2) \;\rightarrow\; O(n \cdot w), \quad w \ll n

    Where:

    • w is the window size (e.g., 512 in Longformer); tokens outside the window get -\infty scores before softmax.
    • n is the sequence length; with w fixed, memory and compute scale linearly in n.

    How Global Context Survives: Stacking L layers grows the effective receptive field to about L \cdot w tokens, similar to CNNs; Longformer additionally designates a few global tokens (e.g., [CLS], question tokens) that attend to and are attended by everything.
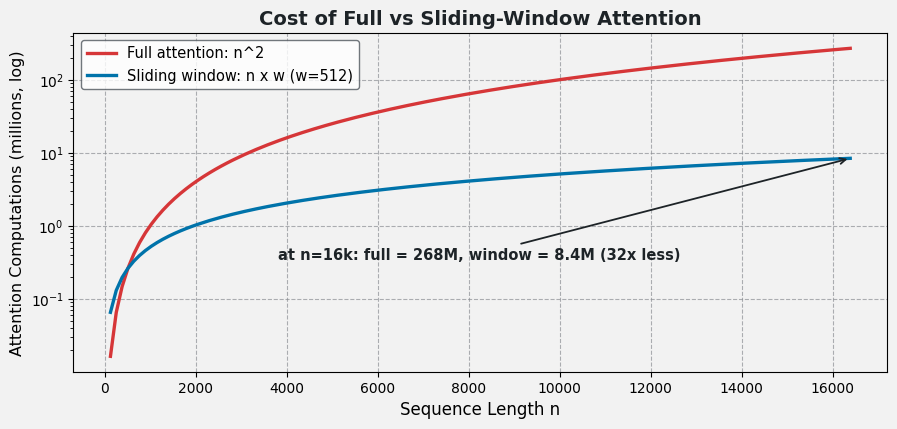
    Log-scale plot comparing n-squared full attention cost against n-times-w sliding window cost, with an annotation showing 32 times fewer computations at sequence length 16 thousand.

    Figure 2: At n = 16{,}384, full attention needs ~268M score computations versus ~8.4M for a 512-wide window, a 32x saving that grows with n.

    Used In: Longformer, BigBird (window + global + random blocks), and many long-document and code models where full O(n^2) attention is infeasible.


    Login to view more content
  • DL0027 Multi-Head Attention

    How does multi-head attention work in transformer architectures?

    Answer

    Multi-head attention runs several attention operations in parallel on different learned projections of the same input: Q, K, V are projected into h lower-dimensional subspaces (one per head), each head performs scaled dot-product attention independently, and the h outputs are concatenated and linearly re-projected by W^O. Each head can specialize in a different relationship (syntax, local neighborhoods, long-range links) so the combined representation is richer than any single attention map.

    (1) Split: Project d_{model}-dim Q, K, V into h heads of dimension d_k = d_{model} / h each.
    (2) Parallel Attention: Every head computes its own softmax-weighted sum; all heads run simultaneously, so total compute is comparable to one full-size head.
    (3) Merge: Concatenate the head outputs and apply output projection W^O back to d_{model}.

    Diagram of Q, K, V splitting into four parallel attention heads with different specializations, concatenating, and passing through an output projection to the model dimension.

    Figure 1: The MHA pipeline: split → parallel attention → concat → project; each head attends in its own subspace.

    Mathematical Formulation:
    \mathrm{MultiHead}(Q, K, V) = \mathrm{Concat}(\mathrm{head}_1, \dots, \mathrm{head}_h)\, W^O
    \mathrm{head}_i = \mathrm{Attention}(Q W_i^Q,\; K W_i^K,\; V W_i^V)

    Where:

    • W_i^Q, W_i^K, W_i^V \in \mathbb{R}^{d_{model} \times d_k} are the per-head projection matrices; h is the number of heads.
    • d_k = d_{model} / h is each head’s subspace dimension (e.g., 512-dim model with 8 heads → d_k = 64).
    • W^O \in \mathbb{R}^{h d_k \times d_{model}} mixes the concatenated heads back to the model dimension.
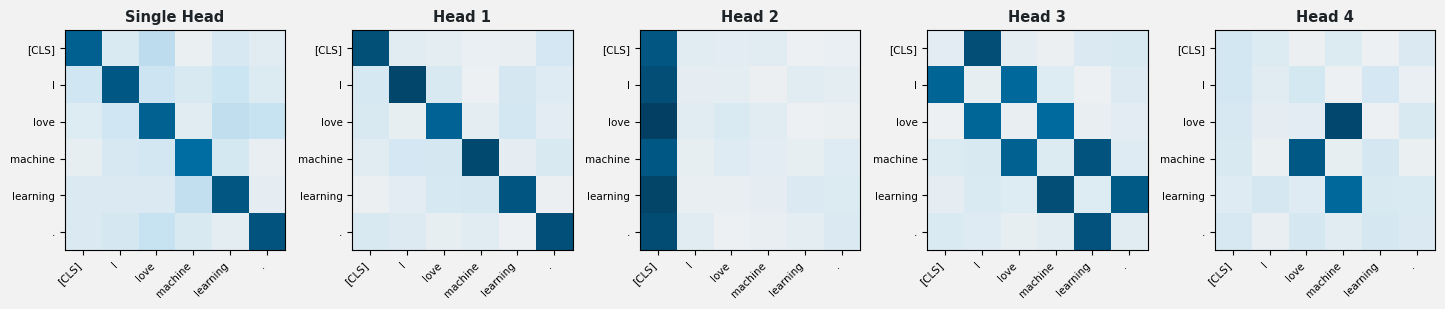
    Why Multiple Heads Help: A single softmax distribution must average every relationship into one map; separate heads let the model attend to different positions and relation types simultaneously. Empirically, heads specialize into recognizable patterns.

    Five attention heatmaps over the same sentence: one single-head map and four multi-head maps showing distinct patterns such as diagonal focus, CLS-column focus, local neighbor bands, and semantic links.

    Figure 2: Same input, four different attentions: heads specialize on position bands, special tokens, and semantic pairs that one head alone could not capture.


    Login to view more content
  • DL0026 Self-Attention vs Cross-Attention

    What distinguishes self-attention from cross-attention in transformer models?

    Answer

    The distinction is where Q, K, and V come from. In self-attention, all three are projections of the same sequence, so every token weighs every other token within its own sequence, modeling internal dependencies. In cross-attention, the queries come from one sequence (e.g., the decoder state) while the keys and values come from a different sequence (e.g., the encoder output), letting one representation selectively read from another. Both use the identical scaled dot-product computation.

    (1) Input Scope: Self-attention: Q, K, V from one sequence; cross-attention: Q from the target sequence, K/V from the source sequence.
    (2) Architectural Role: Self-attention appears in encoder and decoder blocks; cross-attention is the bridge that injects encoder context into each decoder step.
    (3) Score Matrix Shape: Self-attention produces an n \times n map; cross-attention produces n_{dec} \times n_{enc}, rectangular when lengths differ.

    Side-by-side attention heatmaps: self-attention among the tokens The cat sat on the mat, and cross-attention from decoder queries to the encoder sequence The animal rested on a rug.

    Figure 1: Same mechanism, different sources: self-attention relates tokens within one sentence; cross-attention aligns decoder tokens to a separate encoder sequence.

    Mathematical Formulation:
    \mathrm{Attention}(Q, K, V) = \mathrm{softmax}\left(\frac{QK^{\top}}{\sqrt{d_k}}\right) V
    Q = X_{q} W^Q, \quad K = X_{kv} W^K, \quad V = X_{kv} W^V

    Where:

    • X_q is the query-source sequence; X_{kv} is the key/value-source sequence; self-attention is the special case X_q = X_{kv}.
    • W^Q, W^K, W^V are learnable projection matrices; d_k is the key dimension used for scaling.

    Side-by-Side Comparison:

    AspectSelf-AttentionCross-Attention
    Q sourceSame sequenceTarget sequence (e.g., decoder)
    K, V sourceSame sequenceDifferent sequence (e.g., encoder output)
    ModelsIntra-sequence dependenciesInter-sequence alignment
    Score matrixn \times n (square)n_{dec} \times n_{enc} (rectangular)
    Typical locationEncoder & decoder blocksDecoder blocks (bridging to encoder)

    Bottom line: self-attention answers “which of my own tokens matter to me?”; cross-attention answers “which tokens of the other sequence should I read now?”


    Login to view more content
  • DL0025 Attention Mechanism

    Please explain the concept of “Attention Mechanism.”

    Answer

    The attention mechanism lets a model dynamically focus on the most relevant parts of the input when producing each output, instead of compressing the entire input into a single fixed-size context vector. For every output element, attention computes a weighted sum over input representations, where the weights (produced by a similarity score and a softmax) express how much each input element matters for that output. This solved the information bottleneck of early sequence-to-sequence models and is the core operation of Transformers.

    (1) Query (Q): What the current output position is “looking for”: the element being processed.
    (2) Key (K): An index of what each input position offers; queries are compared against keys to get similarity scores.
    (3) Value (V): The actual content retrieved; scores are softmax-normalized into weights that blend the values into the output.

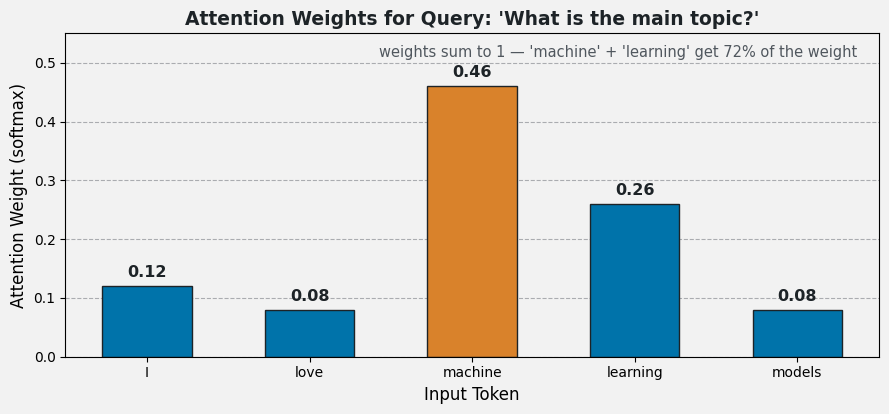
    Bar chart of softmax attention weights over the five tokens I, love, machine, learning, models, with machine receiving 0.46 and learning 0.26 of the total weight.

    Figure 1: Attention weights are a probability distribution over inputs: here “machine” and “learning” absorb 72% of the weight for a topic-focused query.

    Mathematical Formulation (Scaled Dot-Product Attention):
    \mathrm{Attention}(Q, K, V) = \mathrm{softmax}\left(\frac{QK^{\top}}{\sqrt{d_k}}\right) V

    Where:

    • Q, K, V are the query, key, and value matrices, linear projections of the token embeddings.
    • QK^{\top} holds the raw dot-product similarity scores between every query-key pair.
    • \sqrt{d_k} scales the scores (key dimension d_k) to keep softmax out of its saturated, tiny-gradient region; softmax normalizes each row into weights summing to 1.

    Login to view more content
  • ML0065 Random Forest III

    How to choose the number of features in a random forest?

    Answer

    Select the number of features considered at each split (the m, or max_features) by starting from the default heuristics, then tuning with cross-validation or out-of-bag (OOB) error to find the best value for your specific dataset. The choice trades bias against variance and accuracy against training cost.

    (1) Default Heuristics: Classification: m = \sqrt{p}; regression: m = p/3; solid starting points.
    (2) Bias-Variance Trade-Off: Smaller m adds randomness: less correlated trees (lower variance) but potentially higher bias; larger m strengthens each tree (lower bias) but correlates their errors (higher variance).
    (3) Systematic Search: Grid or randomized search over a range of values with cross-validation is the most robust method; OOB error offers a validation-free alternative unique to bagged models.

    Cross validation accuracy versus max features from 1 to 30 with a noisy plateau peaking at 15

    Figure 1: CV accuracy across max_features on a 30-feature dataset: accuracy is poor when m is tiny (trees too weak), then plateaus with a noisy peak at m = 15; the \sqrt{p} \approx 5.5 heuristic lands inside the good region, and CV refinement picks the best value on the plateau.

    Mathematical Formulation:
    m = \sqrt{p} \quad \text{(classification)}
    m = \frac{p}{3} \quad \text{(regression)}

    Where:

    • p is the total number of features in the dataset.
    • m is the number of features randomly drawn and considered at each split (max_features in most libraries).
    • These are heuristics, not optima; cross-validation or OOB error refines them per dataset.

    Login to view more content
  • ML0064 Random Forest II

    Please explain the benefits and drawbacks of random forest.

    Answer

    Random forest is a powerful ensemble method that reduces overfitting and improves predictive accuracy by combining many decision trees. The trade-off: it sacrifices interpretability and computational efficiency, and it may require careful tuning on large, imbalanced, or sparse datasets.

    (1) Benefit: Reduces Overfitting: Aggregating many trees lowers variance.
    (2) Benefit: Robust: Less sensitive to noise and outliers; handles high-dimensional data well.
    (3) Benefit: Feature Importance: Built-in estimates identify influential variables; bagging improves generalization.
    (4) Drawback: Cost: Hard to interpret compared to a single tree; slower to train and predict; large forests consume significant memory.
    (5) Drawback: Data Traps: Class imbalance can bias predictions, and very sparse data can make it underperform other algorithms.

    Random forest versus logistic regression on an imbalanced dataset with minority F1 scores in the titles

    Figure 1: The imbalance trap: on 96/4 skewed data the random forest’s regions bend toward the majority class and its minority-class F1 (0.73) loses even to a class-weighted logistic regression (0.76): a strong default is not automatically strong everywhere.

    Mathematical Formulation:
    \mathrm{Var}\big(\bar{T}(x)\big) = \rho \, \sigma^2 + \frac{1 - \rho}{B} \, \sigma^2

    Where:

    • \bar{T}(x) is the forest’s averaged prediction over B trees, each with individual variance \sigma^2.
    • \rho is the pairwise correlation between trees: this is what bagging and random feature subsets try to shrink.
    • As B \to \infty the second term vanishes but the \rho\sigma^2 floor remains: correlation, not tree count, is the limiting factor.

    Login to view more content