Author: admin

  • DL0041 Hierarchical Attention

    Could you explain the concept of hierarchical attention in transformer architectures?

    Answer

    Hierarchical attention applies self-attention at multiple levels of granularity instead of one flat pass over all tokens: first local attention within segments (words inside a sentence, frames inside a shot), then global attention across the aggregated segment representations (sentences inside a document). This mirrors the natural structure of long inputs, cuts the quadratic cost dramatically, and yields interpretable focus at each level.

    (1) Local Level (Fine-Grained): Each segment runs its own self-attention over its tokens, producing one segment embedding; cost grows with segment length, not document length.
    (2) Global Level (Coarse-Grained): The segment embeddings attend over each other, producing a document-level representation.
    (3) Efficiency Gain: A document of n tokens split into s segments of m tokens costs O(s m^2 + s^2) in attention entries instead of O(n^2), a large saving when m \ll n.

    Two-level hierarchy diagram: word tokens attend inside sentence segments, sentence embeddings then attend globally to form a document embedding.

    Figure 1: Two attention levels: local attention inside each segment, then global attention over segment embeddings to form the document representation.

    Mathematical Formulation (cost for n = s × m tokens):
    \text{Flat:}\quad \mathrm{Cost} \propto n^2
    \text{Hierarchical:}\quad \mathrm{Cost} \propto \underbrace{s\, m^2}_{\text{local}} + \underbrace{s^2}_{\text{global}} \ll n^2

    Where:

    • n is the total token count, split into s segments of m tokens each (n = s \cdot m).
    • The local term runs s independent m \times m attentions; the global term runs one s \times s attention over segment embeddings.

    Example (Document Classification): With n = 4096 tokens as s = 64 sentences of m = 64 words, flat attention scores 16.8\text{M} pairs, while hierarchical attention scores only 64 \cdot 64^2 + 64^2 \approx 0.27\text{M}, roughly 60x fewer pairs.


    Login to view more content
  • DL0040 Attention Mask

    What is the role of masking in attention?

    Answer

    Masking controls which positions attention is allowed to see. Before softmax, disallowed score entries are set to -\infty (a very large negative number), so their attention weights become exactly zero. This one mechanism serves three jobs: preventing future leakage in autoregressive decoding, ignoring padding tokens in batched inputs, and enforcing task structure such as local neighborhoods or blocked spans.

    (1) Causal Mask (Leakage Prevention): Blocks every position j > i so token i cannot read the future, which is mandatory for autoregressive training and decoding.
    (2) Padding Mask: Blocks pad positions so they neither absorb probability mass nor inject meaningless context into real tokens.
    (3) Structured Mask: Encodes task rules (local windows, graph neighborhoods, span blocking) by zeroing arbitrary score entries.

    Mathematical Formulation:
    \mathrm{Attn}(Q, K, V, M) = \mathrm{softmax}\left(\frac{QK^\top}{\sqrt{d_k}} + M\right)V

    Where:

    • M is the mask matrix: 0 for allowed positions, -\infty for blocked ones; adding it before softmax drives blocked weights to zero.
    • Q, K, V are the query/key/value matrices and d_k the key dimension used for scaling.
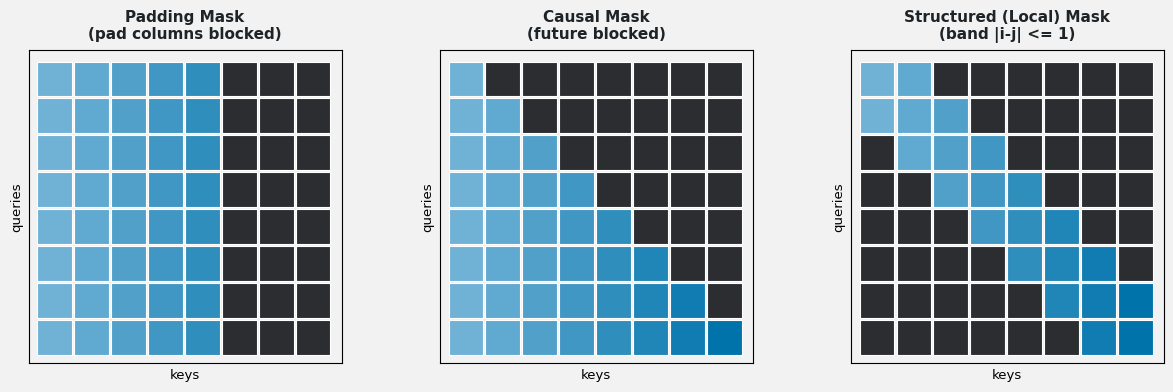
    Three attention score grids side by side showing a padding mask with right columns blocked, a causal mask with the upper triangle blocked, and a structured local mask with only a diagonal band allowed.

    Figure 1: Three mask patterns (rows = queries, columns = keys): padding blocks trailing columns, causal blocks the upper triangle, structured keeps only a local band.

    Why -\infty and Not Zero: Adding zero changes nothing, and deleting columns would break shapes; adding -\infty makes e^{-\infty} = 0 inside softmax, so blocked positions get exactly zero weight while allowed positions renormalize cleanly among themselves.

    Flowchart of masked attention computing raw scores, adding the mask matrix, applying softmax so blocked entries become zero, and multiplying by values.

    Figure 2: Masking in the pipeline: scores are computed, the mask is added, softmax zeroes blocked entries, and only allowed values are mixed.

    Combining Masks: In decoder training the causal and padding masks are summed (broadcast over queries) so a position is blocked if either rule forbids it; a fully masked row would produce NaNs, so real tokens always keep at least their own position unmasked.


    Login to view more content
  • DL0039 Transformer Weight Tying

    Explain weight sharing in Transformers.

    Answer

    Weight sharing (weight tying) reuses the same parameters in multiple places instead of learning separate matrices. The most common form ties the input embedding matrix with the output projection that produces vocabulary logits: one matrix E maps token IDs into d-dimensional space at the bottom and maps hidden states back to logits at the top. A stronger form (ALBERT) shares weights across all Transformer layers, trading capacity for extreme parameter efficiency.

    (1) Embedding–Output Tying: The output logits are computed with the transpose of the input embedding, z = Eh, saving an entire K \times d matrix.
    (2) Consistency Benefit: Input and output spaces share one geometry: tokens that embed close together also get similar output preferences, which acts as a useful regularizer.
    (3) Layer Sharing (ALBERT): One block’s weights are reused for every layer: depth comes from recurrence through the same block, not from new parameters.

    Mathematical Formulation:
    \mathrm{Softmax}(z_i) = \frac{e^{z_i}}{\sum_{j=1}^{K} e^{z_j}}
    z = E\, h

    Where:

    • E \in \mathbb{R}^{K \times d} is the shared embedding matrix, used to look up inputs and, transposed, to score outputs.
    • h \in \mathbb{R}^{d} is the final hidden state; z_i = (Eh)_i is the logit of vocabulary token i; K is vocabulary size.
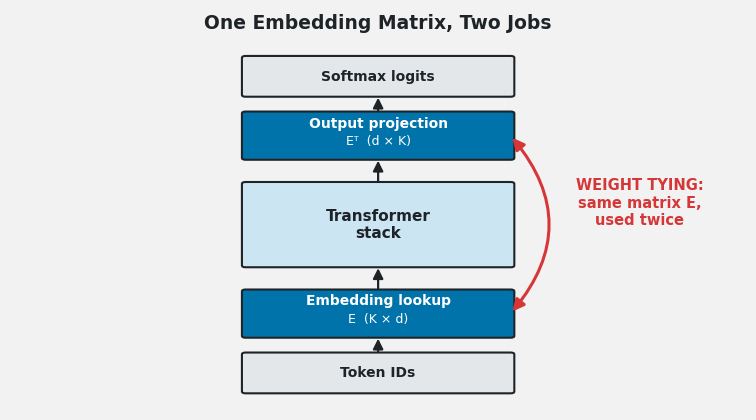
    Diagram of the shared embedding matrix E sitting at the input lookup stage and again transposed at the output projection stage, with an arc labeled weight tying connecting the two uses around the Transformer stack.

    Figure 1: One matrix, two jobs: E embeds input tokens at the bottom and, transposed, projects hidden states to logits at the top.

    How Much It Saves: The untied output projection is a full K \times d matrix; for a 50k vocabulary at d = 1024 that is ~51M parameters, often the single largest matrix in a small model. Tying removes it entirely while typically costing little or no accuracy.
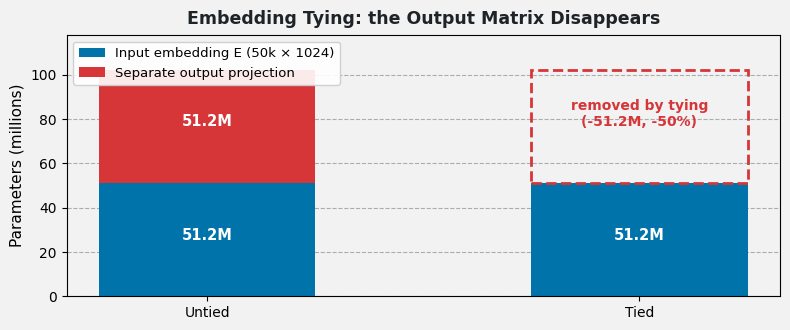
    Bar chart comparing parameter counts of untied versus tied configurations, showing the output projection matrix of fifty million parameters eliminated by tying.

    Figure 2: Tying deletes the output projection matrix, one of the largest single blocks of parameters in vocabulary-heavy models.

    Vocabulary Mismatch Caveat: Tying assumes input and output share a vocabulary. When source and target vocabularies differ (multilingual translation), only the decoder input embedding and output projection can be tied; the encoder embedding stays separate.


    Login to view more content
  • DL0038 Transformer Activation

    Which activation functions do transformer models use?

    Answer

    Transformers use activations in two places. Inside the FFN, the hidden layer applies ReLU (original paper) or, in most modern models, GELU. BERT, GPT, and ViT all standardized on GELU, and newer LLMs adopt gated variants like SwiGLU. Inside attention, softmax normalizes the score matrix into attention weights. The GELU/ReLU choice controls gradient health; softmax controls score interpretability.

    (1) GELU (FFN, modern default): Smooth, probabilistic gating: small negative inputs survive with tiny gradients, avoiding dead neurons and smoothing optimization.
    (2) ReLU (FFN, original): \max(0, x), cheap and effective, but its hard zero can kill neurons permanently.
    (3) Softmax (attention): Converts raw scores into a normalized distribution over keys, giving every query a convex combination of value vectors.

    Single plot comparing ReLU, GELU, and SiLU curves from minus three to three, with ReLU clamping all negatives to zero while GELU and SiLU smoothly dip below zero before rising.

    Figure 1: ReLU clamps negatives to a hard zero; GELU curves smoothly through them: small negative activations keep a non-zero gradient.

    Mathematical Formulation:
    \mathrm{GELU}(x) = x \cdot \Phi(x) = x \cdot \frac{1}{2}\left[1 + \mathrm{erf}\left(\frac{x}{\sqrt{2}}\right)\right]
    \mathrm{Softmax}(z_i) = \frac{e^{z_i}}{\sum_{j=1}^{K} e^{z_j}}

    Where:

    • \Phi(x) is the standard Gaussian CDF: GELU gates the input by its own probability of being positive, a smooth stochastic-regularization view.
    • z_i is one raw attention score and K the number of scored keys; softmax outputs sum to 1.

    Why GELU Won: Its smoothness yields non-zero gradients for negative inputs, reducing the “Dying ReLU” failure; the data-dependent gating acts like a soft, learned threshold. Empirically this means more stable training and better final loss in large language and vision models, which is why BERT/GPT-era models abandoned ReLU in the FFN.

    Flowchart of one Transformer block marking the two activation sites: softmax inside scaled dot-product attention after the score matrix, and GELU between the two linear layers of the feed-forward network.

    Figure 2: The two activation sites in every block: softmax in attention, GELU/ReLU between the FFN’s two linear layers.

    Beyond GELU: Recent LLMs (PaLM, LLaMA) replace the plain activation with gated linear units (SwiGLU/GEGLU), where one projection’s activation multiplies another linear path elementwise; this gating adds quality per parameter and has become the default in state-of-the-art FFN design.


    Login to view more content
  • DL0037 Transformer Architecture III

    Why do Transformers use a dot product, rather than addition, to compute attention scores?

    Answer

    The dot product is a natural similarity measure: q \cdot k is large exactly when query and key point in the same direction, so it directly expresses “how relevant is this key to my query”. It is also a single fused matrix multiplication (QK^\top scores all pairs at once), which is far faster on modern hardware than additive attention’s per-pair MLP. Scaling by 1/\sqrt{d_k} keeps it numerically stable in high dimensions.

    (1) Geometric Meaning: q \cdot k = \|q\|\,\|k\|\cos\theta: aligned vectors score high, orthogonal vectors score zero, opposed vectors score negative.
    (2) Hardware Efficiency: All scores materialize as one GEMM QK^\top; additive attention needs an MLP evaluated for every (query, key) pair.
    (3) Probabilistic Readout: Softmax over dot-product scores yields interpretable attention weights: a distribution over which keys matter.

    2D vector diagram showing three vectors from the origin with a positive dot product between two aligned vectors and a negative dot product between two opposed vectors.

    Figure 1: Dot product as similarity: aligned vectors score positive, opposed vectors score negative; softmax turns scores into attention weights.

    Mathematical Formulation:
    \alpha_i = \frac{e^{q \cdot k_i / \sqrt{d_k}}}{\sum_{j=1}^{n} e^{q \cdot k_j / \sqrt{d_k}}}

    Where:

    • \alpha_i is the attention weight the query assigns to key k_i; weights sum to 1 over the n keys.
    • q \cdot k_i is the dot-product similarity; \sqrt{d_k} scaling prevents softmax saturation for large key dimension d_k.

    Why Not Addition: Adding features component-wise, q + k, says nothing about alignment; two very different pairs can sum to the same vector. To become a usable score, the sum must pass through an extra learnable MLP (v^\top \tanh(W_q q + W_k k)), which is slower per pair and still lacks the dot product’s direct geometric interpretation.

    Comparison flowchart of dot-product attention scoring all pairs in one matrix multiply versus additive attention pushing each query-key pair through a small neural network scorer.

    Figure 2: Dot-product scoring = one batched GEMM; additive scoring = a per-pair MLP, richer but much slower at scale.

    The One Caveat: For large d_k, raw dot products grow in variance proportional to d_k, pushing softmax into saturated, gradient-poor regions, which is why the Transformer uses the scaled dot product rather than the plain one.


    Login to view more content
  • DL0036 Transformer Architecture II

    What are the main differences between the encoder and decoder in a Transformer?

    Answer

    The encoder builds rich bidirectional representations of the source sequence: every token attends to every other token. The decoder is built for generation: its self-attention is causally masked so each position only sees the past, and it inserts an extra cross-attention sub-layer that reads the encoder’s output. Same building blocks, different wiring for two different jobs: understanding vs generating.

    (1) Self-Attention Masking: Encoder self-attention is unmasked (full bidirectional context); decoder self-attention is masked so position t attends only to \leq t.
    (2) Cross-Attention: Absent in the encoder; present in every decoder layer: queries from the decoder state, keys/values from the encoder output.
    (3) Inputs & Role: Encoder consumes the source sequence once; decoder consumes the shifted-right target (teacher forcing) and produces next-token distributions.

    Side-by-side encoder and decoder stacks separated by a dashed line, with the encoder's two sub-layers versus the decoder's three sub-layers and a cross-attention arrow bridging encoder output into the decoder.

    Figure 1: Two stacks, three differences: the decoder adds a causal mask on self-attention and a cross-attention bridge to the encoder output.

    Mathematical Formulation (decoder self-attention mask):
    \mathrm{Attn}(Q, K, V, M) = \mathrm{softmax}\left(\frac{QK^\top}{\sqrt{d_k}} + M\right)V
    M_{ij} = 0 \;\text{if}\; j \leq i,\quad -\infty \;\text{if}\; j > i

    Where:

    • M is the causal mask: -\infty above the diagonal zeroes out future positions after softmax; the encoder simply omits M.
    • i, j index query and key positions; j \leq i means “past or present only”.
    AspectEncoderDecoder
    Self-attentionUnmasked: all positionsMasked: past positions only (causal)
    Cross-attentionNot presentPresent: attends to encoder outputs
    Positional encodingAdded to source embeddingsAdded to target embeddings (shifted right)
    InputSource sequenceShifted target + encoder outputs
    FunctionEncode source into contextual representationsGenerate target autoregressively with source context

    Table 1: Encoder vs decoder at a glance. The decoder is a superset: same sub-layers plus masking and the cross-attention bridge.

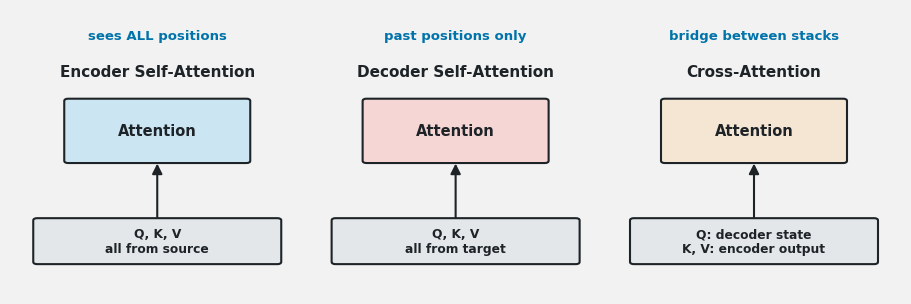
    Three mini diagrams showing query key value sources for encoder self-attention, masked decoder self-attention, and cross-attention with queries from the decoder and keys and values from the encoder output.

    Figure 2: Q/K/V sources for the three attention types: only cross-attention mixes sequences: Q from the decoder, K/V from the encoder.

    Why “Shifted Right”: During training the decoder receives the target sequence shifted one position right (prefixed with a start token), so the prediction at position t is supervised against token t while the input only ever reveals tokens before it. This is teacher forcing, and it keeps training fully parallel despite autoregressive inference.


    Login to view more content
  • ML0066 Model Capacity

    Without activation functions, how does the model capacity of a 2-layer neural network compare to a 20-layer network?

    Answer

    Without activation functions, a neural network, regardless of depth, collapses to a single affine transformation (strictly linear if biases are omitted), so the 2-layer and 20-layer networks have the same representational capacity provided no hidden layer is narrower than \min(d_0, d_L): both can only express affine mappings. Extra depth adds parameters but zero expressiveness: the collapsed map has at most d_0 d_L + d_L effective degrees of freedom, and its rank is capped by the narrowest layer (the bottleneck) and by the input/output dimensions, never raised by depth or by parameter count. Depth alone provides no additional power to capture non-linear relationships; it changes only the optimization dynamics and implicit bias, never the representable function class.

    (1) Layers Collapse: A composition of linear maps is itself linear: stacking 20 of them adds nothing a single layer cannot express.
    (2) Only Bottlenecks Limit Capacity: Only a bottleneck layer (narrower than both input and output) lowers the achievable rank; otherwise a wide 2-layer and a wide 20-layer network express exactly the same affine family. Extra parameters from width or depth are redundant knobs, not more capacity.
    (3) Neither Fits Non-Linear Data: Both are restricted to affine functions of the input (a hyperplane decision boundary for classification), so without non-linearities the extra depth buys no expressiveness for its compute.

    Mathematical Formulation:
    y = W_{\text{eff}}\, x + b_{\text{eff}}
    \text{Params in layer } i = d_{i-1} d_i + d_i

    Where:

    • W_{\text{eff}} = W_L W_{L-1} \cdots W_1 is the effective weight matrix, the product of all layers’ matrices, itself just one matrix; b_{\text{eff}} the effective bias.
    • d_0 and d_L are the network’s input and output dimensions, while d_{i-1} and d_i are the input and output widths of layer i; the per-layer parameter count is weights plus biases.
    • \mathrm{rank}(W_{\text{eff}}) \leq \min(d_0, d_1, \cdots, d_L): even with every hidden layer arbitrarily wide, the rank is still capped at \min(d_0, d_L), and any hidden bottleneck only lowers it further, the only sense in which architecture limits capacity here.
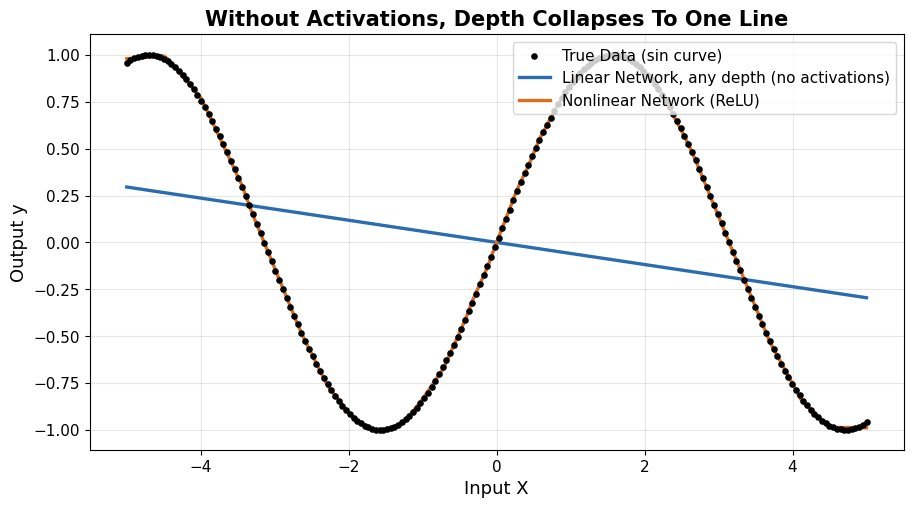
    Sine wave data with a deep linear network fitting only a straight line while a ReLU network tracks the curve

    Figure 1: The collapse in practice: on sine-wave data, a network without activations (blue) fits nothing but a straight line regardless of depth, while the same architecture with ReLU activations (orange) tracks the true curve (black dots) almost perfectly.


    Login to view more content
  • DL0035 Transformer Architecture

    Describe the original Transformer encoder–decoder architecture.

    Answer

    The original Transformer (Vaswani et al., 2017) is a sequence-to-sequence encoder–decoder built entirely from attention: no recurrence, no convolution. The encoder (6 stacked layers) reads the full source sequence and builds a contextual representation per token; the decoder (6 stacked layers) generates the target sequence one token at a time, attending both to its own past outputs and to the encoder’s representations.

    (1) Encoder Layer: Multi-head self-attention (unmasked, so every token sees all positions) followed by a position-wise FFN, each wrapped in residual + LayerNorm.
    (2) Decoder Layer: Masked multi-head self-attention (no peeking at future tokens), then cross-attention to the encoder output, then an FFN, again with residual + LayerNorm throughout.
    (3) Input/Output: Token embeddings plus positional encodings feed both stacks; the decoder’s top passes through a linear + softmax head for next-token probabilities.

    Compact diagram of the original Transformer showing the encoder stack on the left and decoder stack on the right, with cross-attention flowing from encoder output into every decoder layer and a linear softmax head on top.

    Figure 1: The original architecture: 6 encoder layers build source representations; 6 decoder layers generate autoregressively, bridged by cross-attention.

    Mathematical Formulation (one sub-layer):
    z = \mathrm{LayerNorm}\big(x + \mathrm{Sublayer}(x)\big)

    Where:

    • x is the sub-layer input (n \times d_{model} matrix of token vectors, d_{model} = 512).
    • \mathrm{Sublayer} is multi-head self-attention, cross-attention, or the FFN; the residual add + LayerNorm pattern wraps every sub-layer in both stacks.
    Flowchart inside one encoder layer showing input splitting into multi-head self-attention then add-and-norm then feed-forward then add-and-norm, with residual bypass arrows around each sub-layer.

    Figure 2: Inside one encoder layer: two sub-layers (MHA, FFN), each followed by add & norm; the decoder adds a masked self-attention and cross-attention stage.

    Why the Design Works: Self-attention gives every token direct access to every other token (no information bottleneck through a fixed hidden state), residual connections + LayerNorm keep 12-deep training stable, and the masked decoder preserves causality so training can run in parallel via teacher forcing while inference stays autoregressive.


    Login to view more content
  • DL0034 Layer Norm

    What is layer normalization, and why is it used in Transformers?

    Answer

    Layer Normalization (LN) standardizes the features of each individual sample: for one token’s embedding vector, it computes the mean and variance across the feature dimension only, rescales to zero mean and unit variance, then applies a learnable scale and shift. Unlike BatchNorm, it never looks across the batch, which is exactly why Transformers, with variable-length sequences and small or on-the-fly batches, rely on it in every block.

    (1) Normalization Within a Sample: Mean and variance come from the d_{model} features of a single token: one set of statistics per token, not per batch.
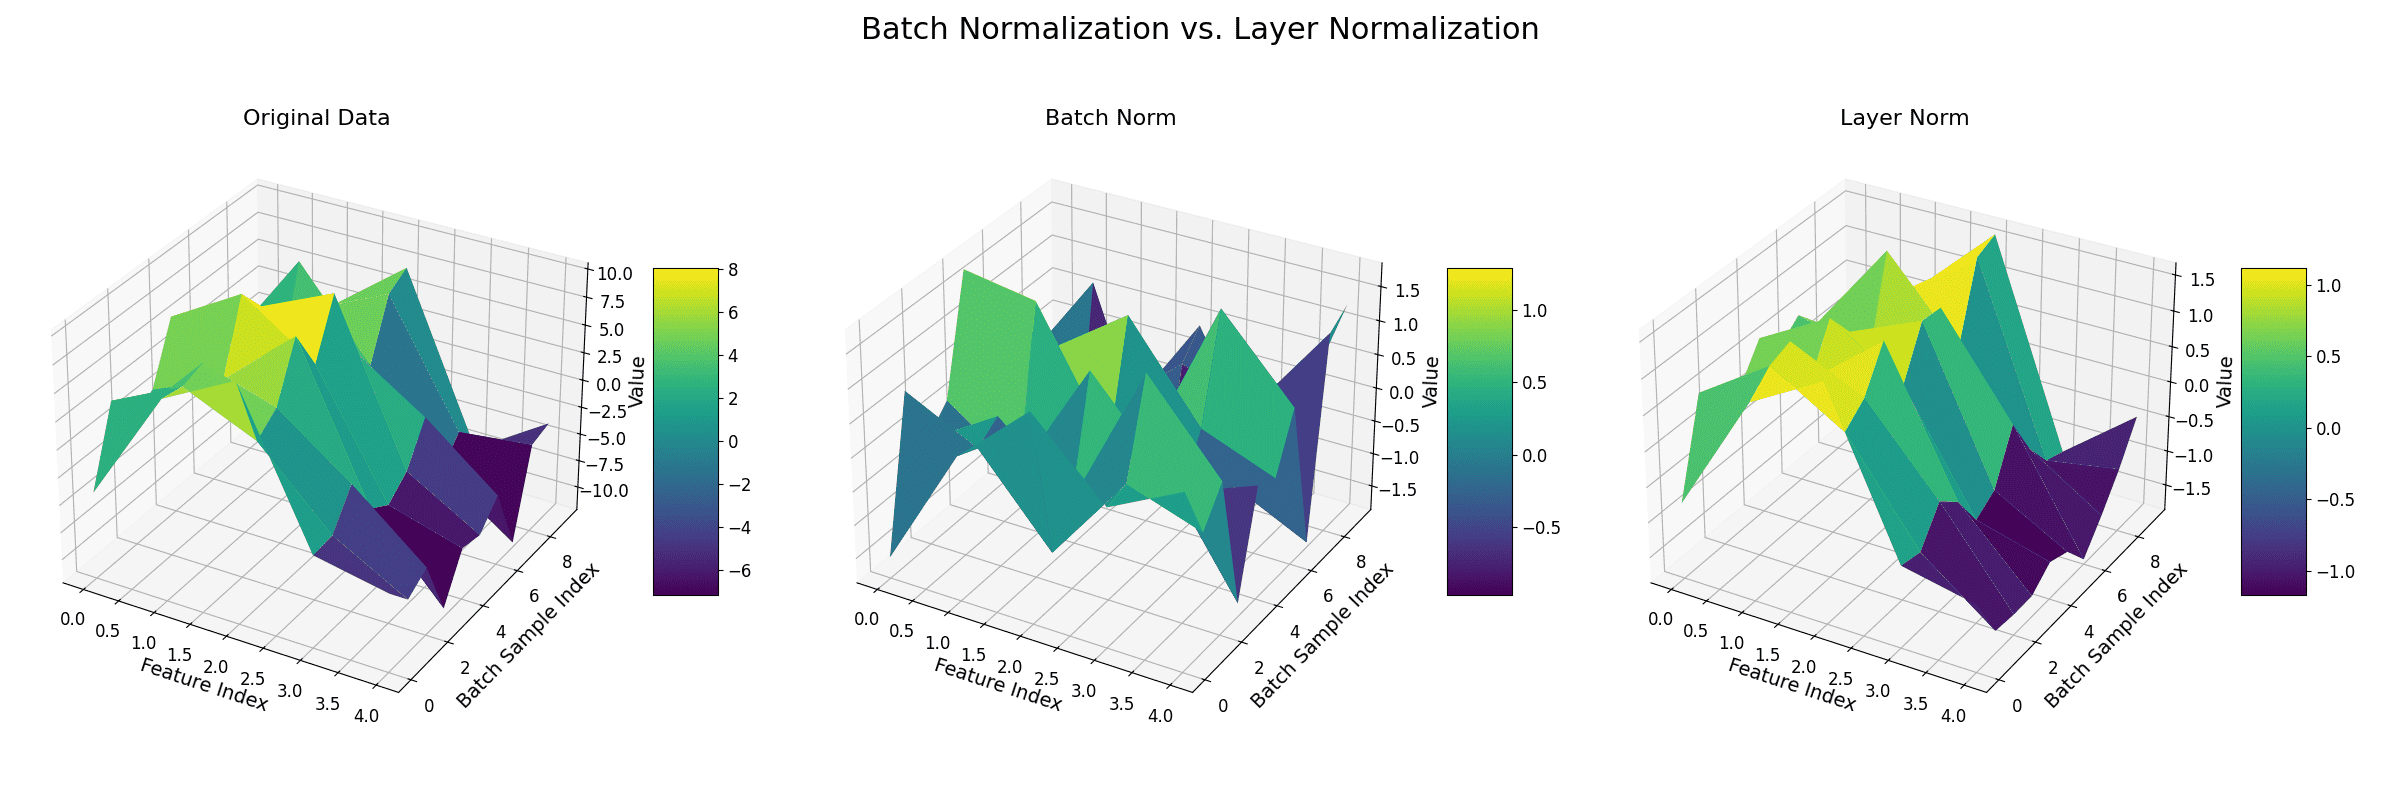
    (2) Batch-Size Independence: Behavior is identical at train and test time and for any batch size: no running statistics, no mismatch.
    (3) Stabilizes Training: Keeps activations in a consistent range, preventing exploding/vanishing gradients and enabling deep stacks to converge faster.

    3D illustration of Layer Normalization: each sample (row) is normalized across its own feature dimensions, independent of the other samples in the batch.

    Figure 1: Layer Normalization standardizes each sample (row) across its own feature dimensions; statistics never cross sample boundaries, so batch size is irrelevant.

    Mathematical Formulation:
    \hat{x}_i = \frac{x_i - \mu}{\sqrt{\sigma^2 + \epsilon}} \cdot \gamma + \beta
    \mu = \frac{1}{d}\sum_{i=1}^{d} x_i
    \sigma^2 = \frac{1}{d}\sum_{i=1}^{d}(x_i - \mu)^2

    Where:

    • x_i is one feature of a single token’s d-dimensional vector; statistics are computed over i = 1..d for that token alone.
    • \epsilon is a small constant for numerical stability; \gamma, \beta are learnable per-feature scale and shift that restore representational freedom.

    Why Not BatchNorm: BatchNorm’s statistics mix information across samples, degrade with small or variable-size batches, behave differently at train vs inference, and pad tokens corrupt the per-feature means of variable-length sequences: all fatal for typical Transformer workloads.

    Two mini flowcharts of a Transformer sub-layer contrasting Post-LN where normalization follows the residual addition with Pre-LN where normalization precedes the sub-layer and the residual path stays clean.

    Figure 2: Placement variants: original Post-LN (after the residual add) vs modern Pre-LN (inside the residual branch), which keeps a clean gradient highway.

    Where It Sits: Every attention and FFN sub-layer is wrapped as \mathrm{LN}(x + \mathrm{Sublayer}(x)) (Post-LN) in the original paper; most modern LLMs use Pre-LN, normalizing the sub-layer input instead, which trains stably even without learning-rate warmup.


    Login to view more content
  • DL0033 Transformer Computation

    In a Transformer architecture, which components are the primary contributors to computational cost, and why?

    Answer

    It depends on sequence length. For short sequences, the feed-forward network (FFN) usually dominates: its two wide GEMMs cost O(n d^2) while attention’s quadratic term is still small. For long sequences, multi-head attention takes over: forming the n \times n score matrix costs O(n^2 d) and grows much faster than anything else in the block.

    (1) Multi-Head Attention: Q/K/V projections cost O(nd^2), but the score matrix QK^\top and its product with V cost O(n^2 d), the quadratic term that explodes on long sequences.
    (2) Feed-Forward Network: Two dense layers with expansion factor 4 cost O(nd^2), dominant when n is small but d is large.
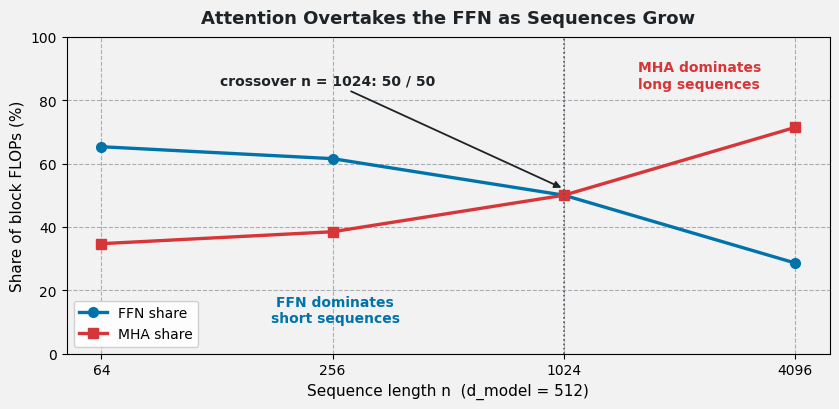
    (3) Crossover Point: Attention overtakes the FFN roughly when n \approx 2d; near n = 1024 for the classic d_{model} = 512 design.

    Line chart of MHA and FFN share of total FLOPs versus sequence length on a log scale, crossing at sequence length 1024 where each takes fifty percent.

    Figure 1: FLOP share vs sequence length (d = 512): FFN dominates below n \approx 1024; past the crossover, attention’s quadratic cost becomes the bottleneck.

    Mathematical Formulation (per block):
    \text{Cost}_{\text{attn}} = \underbrace{4nd^2}_{\text{QKVO projections}} + \underbrace{2n^2 d}_{QK^\top \text{ and } AV}
    \text{Cost}_{\text{FFN}} = 2 \cdot n \cdot d \cdot 4d = 8nd^2

    Where:

    • n is the sequence length and d = d_{model}; constants count multiply–adds per GEMM.
    • The 2n^2 d term comes from multiplying (n \times d) \cdot (d \times n) to form scores, and again to mix values.
    • Softmax itself is cheap elementwise work but also scales with n^2 entries.
    Sequence Length nMHA Share (%)FFN Share (%)Dominant Component
    6434.6965.31FFN
    25638.4661.54FFN
    102450.0050.00Tie
    409671.4328.57MHA

    Table 1: FLOP breakdown at d = 512: the tie at n = 1024 marks where quadratic attention catches up with the linear-in-n FFN.

    Flowchart of one Transformer block annotating each operation with its FLOP complexity: projections linear in n, score matrix quadratic in n, FFN linear in n but quadratic in d.

    Figure 2: Where the FLOPs live inside one block: only the QK^\top and AV pair grows quadratically with sequence length.

    Practical Caveat: The FFN’s dominance at short n assumes the standard 4x expansion; shrink the expansion to 1x and the Q/K/V projections become the largest term, while efficient attention variants (sliding-window, linear attention) specifically attack the n^2 term for long contexts.


    Login to view more content