Author: admin

  • ML0056 K Selection in KNN

    In the context of designing a K-Nearest Neighbors (KNN) model, can you explain your approach to selecting the value of K?

    Answer

    Selecting the optimal value for ‘K’ in a K-Nearest Neighbors (KNN) model is crucial as it significantly impacts the model’s performance.
    (1) Bias-Variance Tradeoff: The choice of K involves balancing bias and variance.
    A small  K (e.g., 1) leads to low bias and high variance, often resulting in overfitting.
    A large  K increases bias but reduces variance, potentially underfitting the data.
    (2) Use Odd Values for Classification: In binary classification, odd  K avoids ties.
    (3) Cross-Validation Combined with Grid Search: Use k-fold cross-validation to evaluate performance across multiple values of  K , and select the one that minimizes the validation error.
    Cross-Validation Error can be calculated by the below equation.
     CV(K) = \frac{1}{N}\sum_{i=1}^{N} \ell\big(y_i, \hat{y}_i(K)\big)
    Where:
     y_i is the actual outcome for the i‑th instance.
     \hat{y}_i(K) represents the predicted value using  K neighbors.
     N is the total number of validation samples.
     \ell is a loss function.
    (4) Domain Knowledge: In some cases, prior knowledge for the data distribution can help select a reasonable range of  K .

    The example below apply k-fold cross-validation with grid search for K selection in one KNN regression task.


    Login to view more content
  • ML0055 KNN Regression

    Please explain how KNN Regression works.

    Answer

    K-Nearest Neighbors (KNN) Regression is a simple, instance-based learning algorithm that predicts a continuous output by finding the K nearest data points in the training set and averaging their output values. Its simplicity makes it easy to understand and implement, but its performance can be sensitive to the choice of K and the distance metric. Additionally, it can be computationally expensive during the prediction phase, especially for large datasets, since it requires comparing the query point to all training samples. KNN is often referred to as a “lazy learner” because it doesn’t build an explicit model during training—it simply memorizes the training data.
    (1) Instance-based method: KNN doesn’t learn an explicit model; it stores the training data and makes predictions based on similarity.
    (2) Distance-based: It finds the K nearest neighbors to a query point using a distance metric (commonly Euclidean distance).
    (3) Averaging Neighbors: The predicted value is the average of the target values of these K nearest neighbors.
    (4) Sensitive to K and distance metric: The performance depends on the choice of  K and how distance is measured (Euclidean, Manhattan, etc.).
    (5) No training phase: All computation happens during prediction (also called lazy learning).

    Below is the equation for the Prediction Calculation in KNN Regression:
    \hat{y} = \frac{1}{K}\sum_{i=1}^{K} y_i
    Where:
    \hat{y} is the predicted value for the query point.
     y_i represents the target value of the i‑th nearest neighbor.
     K denotes the number of neighbors considered.

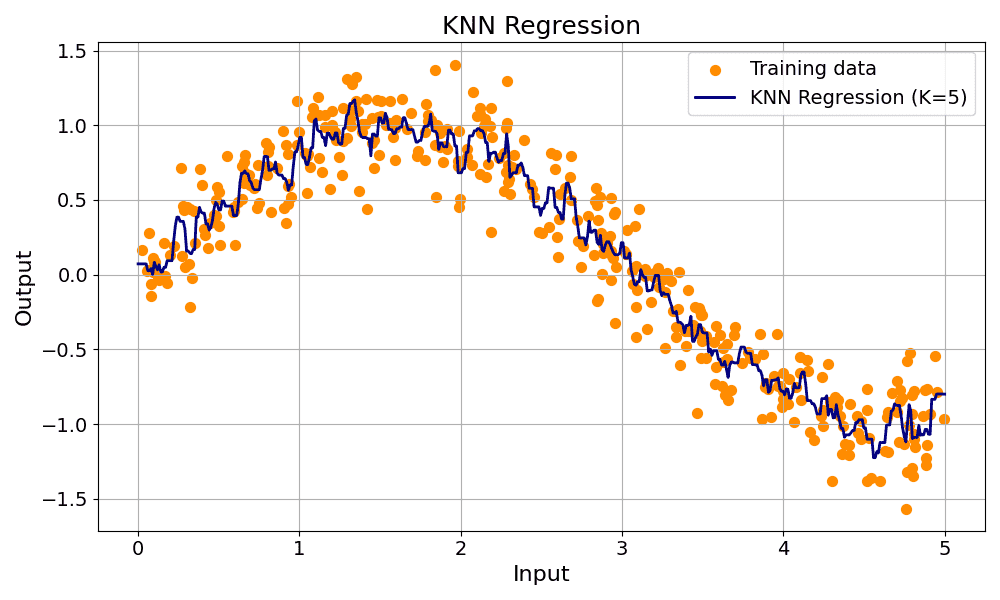
    The example below shows KNN for regression.


    Login to view more content
  • ML0054 KNN Classification

    Please explain how KNN classification works.

    Answer

    K-Nearest Neighbors (KNN) is a simple, non-parametric algorithm that predicts a label by majority vote among the  K nearest neighbors of a test point, using a chosen distance metric. It is intuitive and effective for small datasets, though less efficient on large-scale data.
    (1) Instance-based method: KNN doesn’t learn an explicit model; it stores the training data and makes predictions based on similarity.
    (2) Distance-based classification: For a test point  \mathbf{x} , it computes the distance to every training point (e.g., Euclidean distance).
    (3) Majority vote: It selects the  K closest neighbors and assigns the label that appears most frequently among them.
    (4) Sensitive to K and distance metric: The performance depends on the choice of  K and how distance is measured (Euclidean, Manhattan, etc.).
    (5) No training phase: All computation happens during prediction (also called lazy learning).

    Below is the equation for Euclidean Distance calculation:
    \mbox{distance}(x, y) = \sqrt{\sum_{i=1}^{n} (x_i - y_i)^2}
    Where:
     x_i and  y_i are the ith features of the new and training points, respectively.
     n is the number of features

    Below is the equation for the Voting Rule in KNN classification:
    \hat{y} = \arg\max_{c \in \mathcal{C}} \sum_{i=1}^{K} \mathbb{1}(y_i = c)
    Where:
     \hat{y} is the predicted class label for the query point.
     \mathcal{C} represents the set of all possible classes.
     K is the number of nearest neighbors considered.
     y_i is the class label of the i-th neighbor.
     \mathbb{1}(y_i = c) is an indicator function, returning 1 if the neighbor’s class is  c , and 0 otherwise.

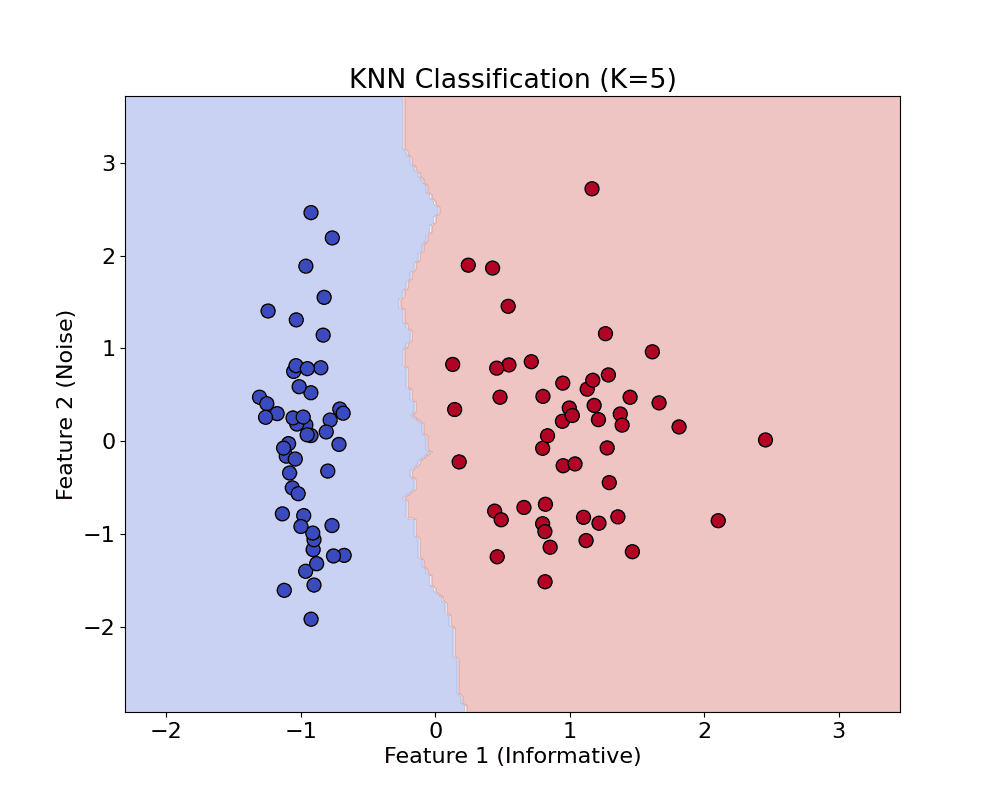
    The example below shows KNN for classification.


    Login to view more content
  • ML0053 Hinge Loss for SVM

    Explain the Hinge Loss function used in SVM.

    Answer

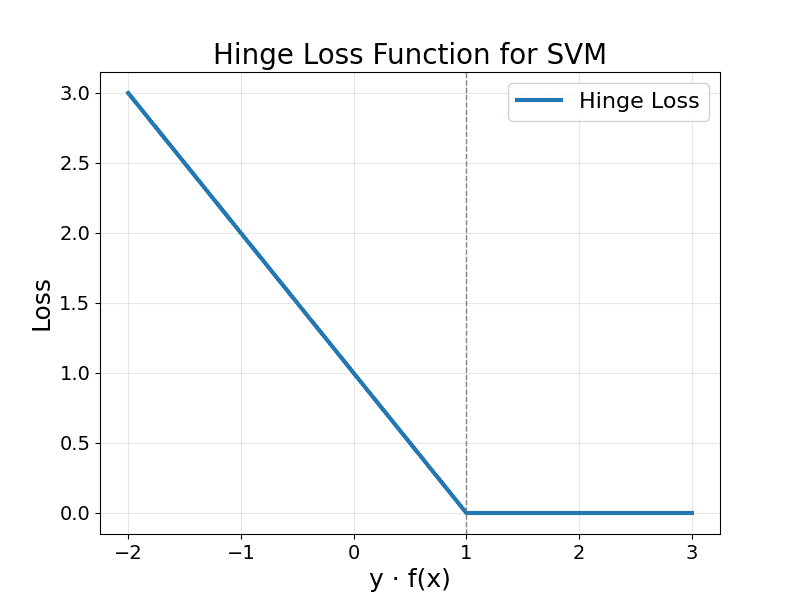
    The Hinge Loss function is a key element in Support Vector Machines that penalizes both misclassified points and correctly classified points that lie within the decision margin. It assigns zero loss to points that are correctly classified and lie outside or exactly on the margin, and applies a linearly increasing loss as points move closer to or across the decision boundary. This loss structure encourages the SVM to maximize the margin between classes, promoting robust and generalizable decision boundaries.

    The Hinge Loss is defined as follows.
     \text{Hinge Loss} = \max(0,\ 1 - y \cdot f(\mathbf{x}))
    Where:
     y \in {-1, +1} is the true label,
     f(\mathbf{x}) is the raw model output.

    Hinge Loss is plotted in the figure below.

    Zero Loss: When  y \cdot f(\mathbf{x}) \ge 1 , meaning the point is correctly classified with margin.
    Positive Loss: When  y \cdot f(\mathbf{x}) < 1 , the point is either inside the margin or misclassified.


    Login to view more content
  • ML0052 Non-Linear SVM

    Can you explain the concept of a non-linear Support Vector Machine (SVM)?

    Answer

    A non-linear SVM allows classification of data that isn’t linearly separable by using a kernel function to project the data into a higher-dimensional space implicitly. This approach, known as the kernel trick, provides flexibility in handling complex datasets while maintaining computational efficiency. The choice of kernel, such as RBF, polynomial, or sigmoid, can greatly influence the performance and adaptability of the model.

    Kernel Trick: Converts input data into a higher-dimensional space where a linear separation is possible, even if the original data is non-linearly separable.

    Common Kernels:
    Polynomial Kernel:
    Uses polynomial functions of the input features to capture non-linear patterns in the data.

    K(\mathbf{x}_i, \mathbf{x}_j) = (\gamma \mathbf{x}_i^\top \mathbf{x}_j + c)^d
    Where:
     \mathbf{x}_i, \mathbf{x}_j are input vectors.
    \gamma controls the scale of the inner product.
     c is a constant that controls the influence of higher-order terms.
     d is the degree of the polynomial.

    Radial Basis Function (RBF) Kernel:
    Measures local similarity based on the Euclidean distance between points; nearby points have higher similarity.
     K(\mathbf{x}_i, \mathbf{x}_j) = \exp\left(-\gamma \|\mathbf{x}_i - \mathbf{x}_j\|^2\right)
    Where:
     \mathbf{x}_i, \mathbf{x}_j are input vectors.
     \|\mathbf{x}_i - \mathbf{x}_j\|^2 is the squared Euclidean distance between the vectors.
    \gamma controls the scale of the inner product.
     \sigma is a parameter that controls the width of the Gaussian (spread).

    Sigmoid Kernel:
    Imitates neural activation by applying a tanh function to the dot product of inputs, introducing non-linearity.
     K(\mathbf{x}_i, \mathbf{x}_j) = \tanh(\gamma \mathbf{x}_i^\top \mathbf{x}_j + c)
    Where:
     \mathbf{x}_i, \mathbf{x}_j are input vectors.
    \gamma controls the scale of the inner product.
    c is a bias term.

    Objective: Determine an optimal hyperplane in the transformed space that maximizes the margin between classes, effectively improving classification performance.

     \max_{\boldsymbol{\alpha}} \sum_{i=1}^{n} \alpha_i - \frac{1}{2} \sum_{i=1}^{n} \sum_{j=1}^{n} \alpha_i \alpha_j y_i y_j K(\mathbf{x}_i, \mathbf{x}_j)

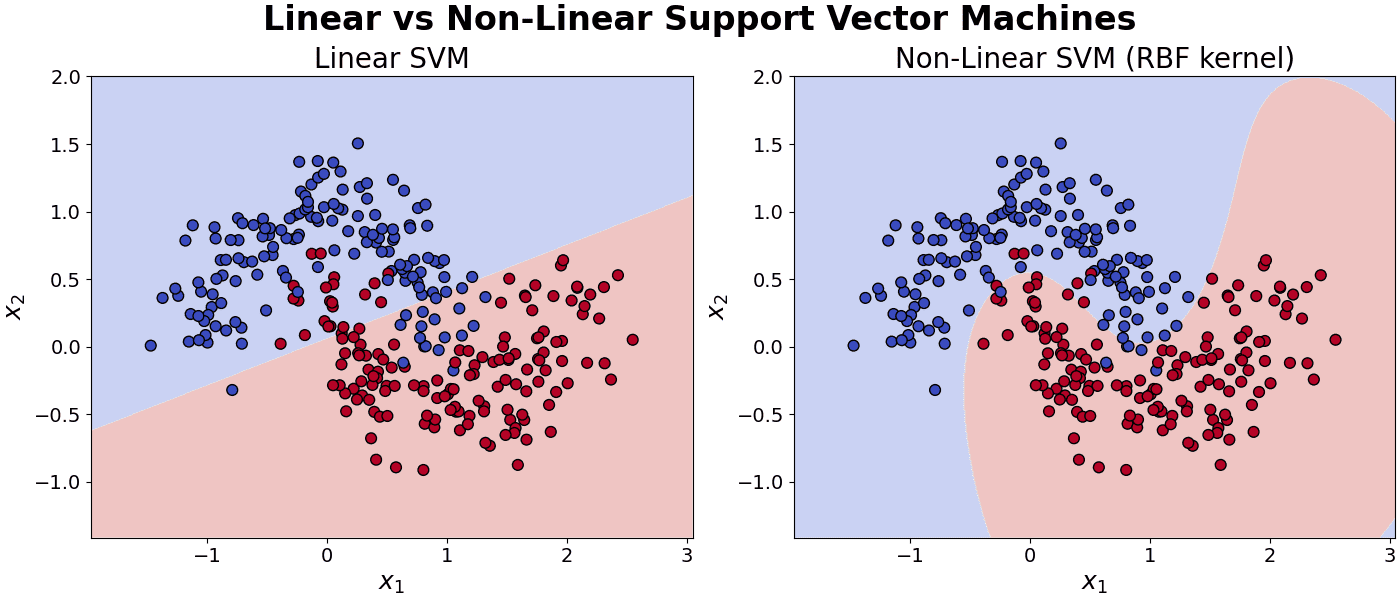
    The example below compares a Linear Support Vector Machine with a Non-Linear Support Vector Machine.


    Login to view more content

  • ML0051 Linear SVM

    Can you explain the key concepts behind a Linear Support Vector Machine?

    Answer

    A Linear Support Vector Machine (Linear SVM) is a classifier that finds the optimal straight-line (or hyperplane) separating two classes by maximizing the margin between them. It relies on a few critical points (support vectors) and offers strong generalization, especially for linearly separable data.

    Key Concepts of a Linear Support Vector Machine:
    (1) Hyperplane: A decision boundary that separates data points of different classes.
    (2) Margin: The distance between the hyperplane and the nearest data points from each class.
    (3) Support Vectors: Data points that lie closest to the hyperplane and define the margin.
    (4) Objective: Maximize the margin while minimizing classification errors.

    Here is the Linear SVM Decision Function:
     f(\mathbf{x}) = \mathbf{w}^\top \mathbf{x} + b
    Where:
     \mathbf{x} is the input feature vector.
     \mathbf{w} is the weight vector.
     b is the bias term.

    Here is the Linear SVM Classification Rule:
     \hat{y} = \mbox{sign}(\mathbf{w}^\top \mathbf{x} + b) = \mbox{sign}(f(\mathbf{x}))
    Where:
     \hat{y} is the predicted class label.
     \mbox{sign}(\cdot) returns +1 if the argument is ≥ 0, and −1 otherwise.

    For Hard Margin SVM, here is the Optimization Objective:
     \min_{\mathbf{w}, b} \quad \frac{1}{2} \|\mathbf{w}\|^2
    Subject to:
     y_i(\mathbf{w}^\top \mathbf{x}_i + b) \geq 1 \quad \text{for all } i
    Where:
     y_i \in {-1, 1} is the class label for the i-th data point.
     \mathbf{x}_i is the i-th feature vector.

    The example below shows Hard Margin SVM for solving a classification task.


    Login to view more content
  • ML0050 Logistic Regression III

    Why is Mean Squared Error (L2 Loss) an unsuitable loss function for logistic regression compared to cross-entropy?

    Answer

    Mean Squared Error (MSE) is unsuitable for logistic regression primarily because, when combined with the sigmoid function, it can lead to a non-convex loss landscape, making optimization harder and increasing the risk of poor convergence. Additionally, it provides weaker gradients when predictions are confidently incorrect, slowing down learning. Cross-entropy loss is better suited as it aligns with the Bernoulli distribution assumption, produces stronger gradients, and leads to a well-behaved convex loss for a single neuron binary classification setting.

    (1) Wrong Assumption: MSE assumes a Gaussian distribution of errors, while logistic regression assumes a Bernoulli (binary) distribution.
    (2) Non-convex Optimization: MSE with sigmoid can create a non-convex loss surface, making optimization harder and less stable.
    (3) Gradient Issues: MSE leads to smaller gradients for confident wrong predictions, slowing down learning compared to cross-entropy.
    (4) Interpretation: Cross-entropy directly compares predicted probabilities to true labels, which is more appropriate for classification.

    The figure below shows the non-convex loss surface when MSE is used for logistic regression.


    Login to view more content
  • ML0049 Logistic Regression II

    Please compare Logistic Regression and Neural Networks.

    Answer

    Logistic Regression is a straightforward, linear model suitable for linearly separable data and offers good interpretability. In contrast, Neural Networks are powerful, non-linear models capable of capturing intricate patterns in large datasets, often at the expense of interpretability and higher computational demands.

    The table below compares Logistic Regression and Neural Networks in more detail.


    Login to view more content
  • ML0048 Logistic Regression

    Can you explain logistic regression and how it contrasts with linear regression?

    Answer

    Logistic regression maps inputs to a probability space for classification, while linear regression estimates continuous outcomes through a direct linear relationship.

    Logistic regression model estimates the probability that a binary outcome (y = 1) occurs, given an input vector (x)
    \Pr(y=1 \mid \mathbf{x}) = \frac{1}{1 + e^{-(\mathbf{w}^{\top}\mathbf{x} + b)}}
    Where:
    \mathbf{x} is the input feature vector,
    \mathbf{w} is the weight vector, and
    b is the bias term.

    Logistic Regression vs. Linear Regression:
    Linear Regression:
    Purpose: Predicts a continuous output (e.g., price, height).
    Output: Real number (can be negative or >1).
    Assumes: Linearity between input features and output.

    Logistic Regression:
    Purpose: Predicts a probability for classification (e.g., spam or not).
    Output: Value between 0 and 1 using sigmoid function.
    Interpreted as: Probability of class membership.

    Here is a table comparing Logistic Regression with Linear Regression.


    Login to view more content
  • DL0024 Fixed-size Input in CNN

    What is the “dilemma of fixed-size input” for CNNs? How is it typically resolved?

    Answer

    The “dilemma of fixed-size input” for Convolutional Neural Networks (CNNs) refers to the requirement that traditional CNN architectures demand input images of a predetermined, fixed size. This presents a challenge because real-world images often vary widely in dimensions.

    Fixed Input Requirement: Traditional CNN architectures (like VGG or ResNet) require inputs of a fixed size due to the structure of fully connected layers at the end.
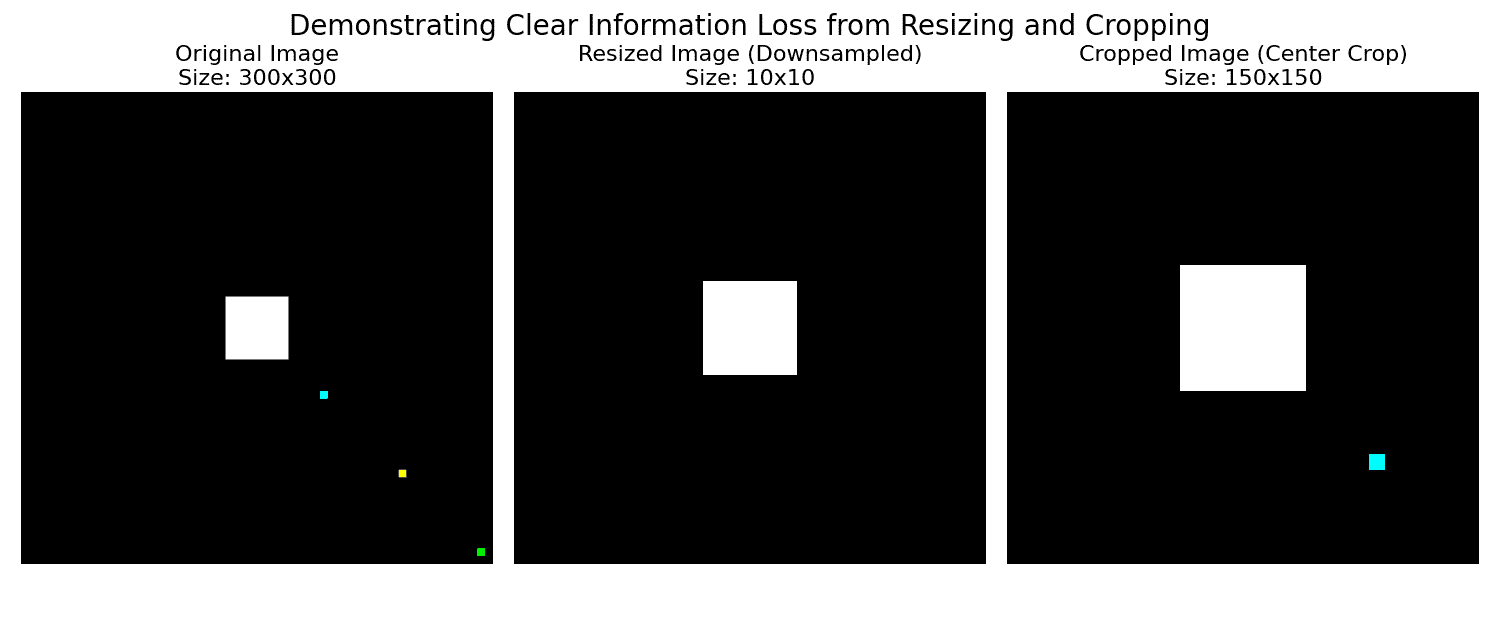
    Data Preprocessing Constraint: Real-world images vary in size, so they must be resized or cropped, which may distort or lose important features.
    Inefficiency & Information Loss: Resizing may stretch or compress content unnaturally, affecting model performance.

    Below shows an example of information loss during resizing or cropping.

    Common Solutions for the dilemma of fixed-size input:
    (1) Global Average Pooling (GAP): Replaces fully connected layers, allowing input of variable size and reducing overfitting.
    (2) Fully Convolutional Networks (FCNs): Use only convolutional and pooling layers, which can handle variable-sized inputs.
    (3) Adaptive Pooling (e.g., in PyTorch): Pools features to a fixed size regardless of input dimensions.


    Login to view more content